Can you create donut charts exceeding 100%?

In 2024 the #WOW coaching crew has extended to include Yusuke Nakanishi (@YusukeNakanish3) and Yoshitaka Arakawa (@yoshi_dataviz) from the Japanese #datafam. This week Yusuke set this challenge asking us to build donut charts that represented when percentages were > 100%.

Building out the calculations

In the data set provided the Self-sufficiency ratio for food in calorie base [%] is a number that represents the actual % value ie 90 means 90%, 196 means 196%. To help me remember that, I formatted the field to be a number with 0 decimal places which had a % suffix.

But building the donut charts we need to ‘normalise’ the figures to represent a percentage out of 100. ie, if the value is 90%, we want 90%, but if the value is 196%, we want 96%. So I created

Self Sufficient %

([Self-sufficiency ratio for food in calorie base 【%】] %100) / 100

and then formatted this to a % with 0 dp.

but I can’t build a donut chart with just this value, I need to know the non self sufficient % too

Not Self Sufficient %

1-[Self Sufficient %]

and formatted this to be a % with 0 dp too.

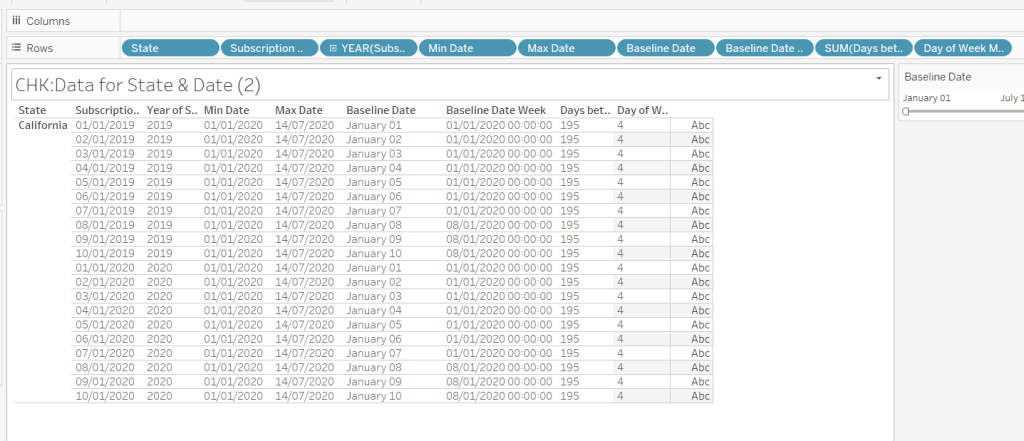
Let’s put these into a tabular view. Add Prefecture to Rows and Measure Names to Columns. Add Measure Values to Text. Add Measure Names to Filter and restrict to the fields Self-sufficiency ratio for food in calorie base [%], Self Sufficient % and Not Self Sufficient %. Add Fiscal Year to Filters and restrict to FY2018. Sort the data by Self-sufficiency ratio for food in calorie base [%] descending.

You can see those rows where the Self-sufficiency ratio for food in calorie base [%], Self Sufficient % and Not Self Sufficient % is over 100% have a different value for the Self Sufficient %.

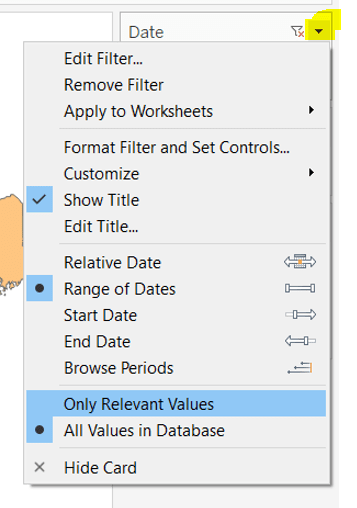
Showing the Fiscal Year as a filter the user can select, I can change to FY2019 and also see how these fields are behaving; ie when Self-sufficiency ratio for food in calorie base [%] is also over 200%, I’m getting the ‘remainder’ over 200 displayed ie 216% has a Self Sufficient % of 16%, which is what is needed for the ‘bonus’ challenge.

However, due to the way I’m building, I’m going to able to get the display working for the top & bottom 7 records regardless of year (making the build of the bonus challenge a bit easier).

So with this in mind, I now what to categorise the Self-sufficiency ratio for food in calorie base [%] based on what percentage range the values fall into.

% Bracket

FLOOR([Self-sufficiency ratio for food in calorie base 【%】] / 100)

This gives me values of 0, 1 and 2. By default this field will be created within the ‘measures’ section of the data pane (ie below the line). Drag it into the top section to convert it to a discrete dimension. Alias the values (right click -> Aliases) and set as below:

Then add to Rows.

and with the filter still set for FY2019, we can see the rows are categorised into 3 brackets.

Set the filter back to 2018. Now we want to restrict to the top and bottom 7 records only. For this I use Sets.

Create a set against Prefecture (right click the field > create > set).

Top 7

Top 7 records by Sum of Self-sufficiency ratio for food in calorie base [%]

Then create another set, this time for the bottom 7

Bottom 7

Bottom 7 records by Sum of Self-sufficiency ratio for food in calorie base [%]

Then create a Combined set (right click on one of the sets > create Combined set), that includes all values from both sets

Records to Include

Add this to the Filter shelf. By default it will show the records ‘in’ the set. However based on how the order of operations in Tableau works, this will apply the conditions based on the set first before it considers the year being filtered. Ie it will get the top and bottom 7 records based on the total sum of the Self-sufficiency ratio for food in calorie base [%] field for all the data in the data set, then filter to 2018. It means it could show some records that were in the top 7 overall, but not in the top 7 for 2018. To resolve this, and to ensure the data gets filtered by the Fiscal Year first, we need to add the Fiscal Year pill on the Filter shelf to context (right click pill and Add to Context). The pill will go grey.

Next we need a way to ‘categorise’ which rows are the top and which are the bottom. Add Top 7 to Rows which will split the rows into In or Out. Alias these values so In displays as Top 7 and Out displays as Bottom 7 (right click the text > Edit Alias).

Finally, when we build the viz, we need to ensure the 7 entries for each section align with each other. For this create

Top | Bottom Index

INDEX()

and convert the field to Discrete, then add to Rows before the Prefecture pill. Edit the table calculation so that it is computing based on the Prefecture and % Bracket pills only. This gives us an index from 1-7 for each set.

Building the Top & Bottom 7 Donut chart

On a new sheet, add Fiscal Year to Filter and set to 2018. Add the pill to context. Show the filter. Also add Records to Include to Filter.

Add Top 7 to Rows, then double click into rows and manually type MIN(0) to create a ‘fake axis’. Change the mark type to Pie.

Add Prefecture to Detail and Measure Values to Angle. Ensure only Self Sufficient % and Not Self Sufficient % are the only measures displayed (remove any others by dragging them out of the Measure Values box). Add Measure Names to Colour.

Add Top | Bottom Index to Columns and edit the table calculation so it is just computing by Prefecture. This should now give 7 columns of pie charts.

Add a Sort to the Prefecture pill on the Detail shelf, so it is sorting by the Self-sufficiency ratio for food in calorie base [%] field descending.

Add % Bracket to the Detail shelf, then click on the 3 dot icon to the left, and select the colour icon to add this pill to the Colour shelf as well as the Measure Names pill.

Re-edit the table calculation associated to the Top | Bottom Index pill so it is now also computing by the % Bracket field, so you get back to your correct top & bottom 7.

Adjust the order of the pills on the Colour shelf so that the % Bracket pill is listed before the Measure Names pill. Also adjust the order of the pills in the Measure Values box so Self Sufficient % is listed before Not Self Sufficient %.

Then adjust the colours on the colour legend as below and add a dark border to the marks (via the colour shelf).

Change the year filter to FY2019, and you can adjust the colours for the 200% entries too.

To make the ‘hole’ in the donut, double click into the Rows and add another instance of MIN(0). This will create a 2nd MIN(0) marks card.

On that marks card, move Prefecture from Detail to Label. Remove % Bracket, Measure Names and Measure Values. Add Self-sufficiency ratio for food in calorie base [%] to Label. Change the mark type to circle. Set the Colour of the circle to white. Align the label middle centre, and adjust the format/font to suit.

Set the chart to be dual axis and synchronise the axis. Adjust the Size of the pie chart mark independently from the size of the circle mark, so one is slightly larger than the other.

Finally tidy up the display by hiding the axis (uncheck show header), and the Top | Bottom Index field. Remove all gridlines, zero lines, axis lines/ticks and row/column dividers. Hide the In/Out Top 7 field label heading (right click label and hide field labels for rows. Update the title of the sheet so it references the Fiscal Year field. Change the filter back to 2018. Hide all tooltips.

Building the Legend

On a new sheet double click into Columns and type MIN(0.0). Add % Bracket to Rows. Change the mark type to square and add % Bracket to Colour and Label. Adjust colours to suit and add dark border to shape.

From the donut chart sheet, click on the Fiscal Year pill in the Filter shelf and set to apply to worksheets > selected worksheets and select the sheet you’re building the legend on. This will add the pill to this sheet too and changing the value on one sheet will impact the other.

Edit the axis so it is fixed to start at -0.1 and end at 1. This will shift the display to the left.

Hide the axis, and the % Bracket header column; remove all gridlines, zero lines, row/column dividers. Hide the tooltips.

Both the legend and the donut can now be added to a dashboard, and you’ve completed the main challenge. I chose to add the Fiscal Year filter to the display so the user could switch years if they wished.

The bonus challenge – Building the trellis chart

Because of how I’ve built the above, we’ve already done the hard work to handle the 200%+ data. The challenge here now is just to display all the 47 Prefectures for a given year in a 10 x 5 grid – a trellis.

So to build this, I started with the donut chart already built and duplicated the sheet.

When creating trellis charts, we need to create fields that represent which row and which column each Prefecture should sit in. There’s lots of blogs on creating trellis charts. As we know the number of rows and columns we need, I created

Cols

INT((INDEX()-1)%10)

Take the index of each Prefecture, decrement by 1 and find the remainder when divided by 10. This means the Prefecture with the highest % value at at position (rank) 1 will be positioned in column (1-0)%10 = 0. The Prefecture at position 11 will also be positioned in column (11-1)%10 = 0.

We also need

Rows

INT((INDEX()-1)/10)

Take the index of each Prefecture, decrement by 1 and divide by 10.

Convert both fields to be Discrete.

From the duplicated sheet, remove Top | Bottom Index from Columns and In/Out Top 7 from Rows. Remove Records to Include from Filter. Don’t panic if things look odd!

Add Cols to Columns. Adjust the table calculation to compute by both %Bracket and Prefecture. Specify the sort order to be a custom sort on the field Self-sufficiency ratio for food in calorie base [%] descending.

Now add Rows to Rows and apply the same settings on the table calculation. If all is well, you should have all 47 donuts displaying in the correct order.

Hide the Cols and Rows headings, and you can then add this to another dashboard.

My published viz is here: Top & Bottom 7 | Trellis

Happy vizzin’!

Donna

A tricky filter

In this week’s challenge, Erica set us the task of building a filter that only contained a subset of the dimension values – ie a set of core values always had to remain in the view, and weren’t available to be filtered out.

Erica advised there were hints available, and that she had solved the problem herself via an existing Tableau Knowledge Base article.

The requirements stated Sets were involved and so I attempted down this path, creating a set to store the ‘core’ cities (as per the requirements), and then using a combined set of all cities and ‘core’ cities to just display the values not in ‘core’. However I couldn’t get things working, so I checked out the hints.

The first hint alluded to 2 sheets, which initially I thought one for the ‘core’ cities and one for the rest, but quickly realised this would only work if there hadn’t been the additional ‘bonus’ requirement to sort the data based on the sales (ie the core cities and the rest could become interspersed in the viz).

So after further fiddling, and unsuccessful ideas, I ended up referencing the KB article and built out a solution. After publishing, my good friend and fellow #WOW participant Rosario Gauna, published her solution which she managed in a single sheet, and in a manner that was much more elegant. So it’s a double solution guide today – what I did based on the KB article and a recreation of Rosario’s solution (so I have this to reference and remind myself if ever I have the need to recreate).

Solution 1 – The 2 sheet solution

Firstly, create a set called Key Cities (right click on City > Create > Set) and select the 5 cities listed in the requirements.

Key Cities

On a new sheet, add State/Province to the Filter shelf and choose Ohio, then add City to Rows and Sales to Columns and sort descending. Add Key Cities to Colour and adjust accordingly.

Call this sheet Sales by City

On a new sheet, add State/Province to Filter and select Ohio, then add City to Rows. Call this sheet Filter Sheet.

Duplicate the City field (right click field in the data pane and select Duplicate). This will create a new field called City (copy) in the data pane.

Add City (copy) to the Filter shelf of the Filter Sheet sheet, select the 5 core cities and then check the Exclude checkbox.

Add the original City field to the Filter shelf as well and select All. Show the filter on the sheet, and adjust so it displays Only Relevant Values

The list of options in the filter list should only show the cities in Ohio that aren’t one of the five key states.

Set the City filter to Apply to Worksheets > Selected worksheets and select the Sales by City worksheet

Customise the City filter in the Filter Sheet sheet so that the All option does not display. From the context menu of the City filter control, select Customise and ensure Show ‘All’ Value is unchecked.

Navigate back to the Sales by City sheet and show the City filter values, ensuring all are displayed. This list will include the key cities, but don’t worry. Uncheck a value that isn’t in the list of key cities eg Bowling Green. The city will disappear from the viz, but if you navigate to the Filter Sheet, you should also see the value is unselected in that list too.

This is the filtering behaviour we’re after – selections made to the City filter on the Filter Sheet affect the values in the City filter on the Sales by City sheet.

Now we need to address the sorting.

Again I think I ended up doing something a bit more complicated than needed – check out the sorting described in the 2nd solution, as that would apply here too – it just isn’t what I did at the time.

Firstly, we need a parameter to determine which sort selection to use

pSort

string parameter containing two list entries Key Cities and Sales, defaulted to Key Cities

I decided I wanted to sort by a number, which for Sales was fine, but when Key Cities was selected, I needed to ensure the values for the Key Cities were always greater than the maximum value for the non key cities. For this I needed to get a handle on the value of sales for the non key city that had the largest sales.

Max Non Key Sales

{FIXED : MAX(IF NOT [Key Cities] THEN ({FIXED [State/Province], [City] : SUM ([Sales])})END)}

If the city is not a key city, then get the total sales for each State & City (potential that a city can exist in multiple states, hence the need to declare the State), and then return the max of those.

To see what this is doing, on a new sheet, add State/Province to Filter and select Ohio, then add Key Cities and City to Rows and Sales to Text and sort by Sales descending

We’re looking for the value 8203 as this is the largest sales for the cities not tagged as a Key City.

Add Max Sales Non Key City to the view…. the value doesn’t match what we expected.

This is because a FIXED level of detail (LOD) calculation works across the entire data set, so the fact we’ve filtered by Ohio is being disregarded. To resolve this, set the State/Province field on the Filter shelf so it is Add To Context

This pill will change to grey, and the values should update, as now the LOD is being applied after the context filter has been applied.

With this we can work out a sort field

Sort

CASE [pSort]
WHEN ‘Sales’ THEN SUM([Sales]) * -1
ELSE
(IF ATTR([Key Cities]) THEN SUM([Sales]) + SUM([Max Sales Non Key]) ELSE SUM([Sales]) END) * -1

END

If we’re sorting by Sales then use the total Sales value * -1, otherwise, if we’re sorting by Key Cities then, if the City is a key city, then add the total sales to the max sales value, otherwise just use the total sales value. Multiple the result by -1. By adding this value, it ensures the values for the Key Cities are always larger than those for the non key cities. The -1 means the sort will be descending.

Test this out, by adding the Sort field as a discrete (blue) field to the Rows of the test sheet we’ve been using above. Ensure the Sort field is listed first, and move the Key Cities field to be third. Show the parameter control, and test switching between the options. The values in the Sort field are always in an ascending order, but the displayed Sales values will be ordered depending on the sort option chosen

Back on the Sales by City sheet, add the Sort pill to the Rows before the City pill, and add the State/Province filter to context.

Hide the Sort field.

The labels need to be displayed inside the bars, so for this we need a dual axis.

Add another copy of Sales to the Columns. On the second Sales marks card, set the option to Show mark labels from the Label shelf. We need the text of the label to be different to the existing bars, so create a duplicate of the Key Cities field, so we have Key Cities (copy) and add this to the Colour shelf of the second marks card. Adjust the colours accordingly to white and black.

Change the mark type of the 2nd marks card to Gantt bar, reduce the opacity of the Colour to 0% and reduce the Size to as small as possible. Adjust the alignment of the Label to left middle, and set the font to be bold and match mark colour.

Make the chart dual axis and synchronise the axis. Set the mark type of the first marks card back to a bar if it changes.

Remove all row and column dividers, and hide the top axis. Hide the City column label too. Edit the bottom axis, and fix to start from 0 and end automatic. Adjust the tick marks to display every 5000 values.

Add this sheet to a dashboard. Remove the colour legends that automatically get added and remove the City filter control too. Leave the sort parameter.

Then add the Filter Sheet as a Floating object and position bottom right. The City filter for this sheet should also automatically display. If it doesn’t show it (click the context menu of the Filter Sheet object > Filters > City).

Change the City filter to be a multiple values dropdown control and set it to be fixed (unselect the Floating option on the context menu).

Now hide the title on the Filter Sheet object and resize to make it teeny tiny, so you can’t see anything

Now you have the core objects needed for a functional dashboard – you’ll just want to take some time moving them into place, and excluding other Cities.

My workbook that matches this solution is here.

Solution 2 – the 1 sheet solution

So shout out again to Rosario Gauna, as this is actually her solution!

We’ll build this out in a table first, so we can see what’s going on.

On a new sheet add State/Province to Filter and select Ohio, then add City and Key Cities (the set created above) to Rows. Add Sales to Text.

What we’re going to do is create another set which will just contain the cities not identified as key cities. For this, we need to store against every row (including the key cities) the name of a City that isn’t a key city. For those that already aren’t a key city, that is just its own City name, but for those that are key cities, we want to store a non key city…. sounds confusing right…. let’s build this up.

Firstly, let’s just get those non key cities

Non Key City

IF NOT [Key Cities] THEN [City] END

Add this to the sheet. It shows NULL against all the Key Cities and the City value for all the others

We’re going to use this to set a ‘default; value against the key cities.

Min Non Key City

{FIXED: MIN([Non Key City ])}

Theis returns the value from the Non Key City field which is alphabetically first. Using MAX would work just as well. When we add this to the sheet, we also need to set the State/Province filter to be Add to Context, otherwise we get a City from the whole data set, and not just Ohio.

We can now create a field that will just contain a distinct list of the non key cities

Other Cities

IF NOT [Key Cities] THEN [City] ELSE [Min Non Key City] END

Add this to the sheet

For every City, the Other Cities field contains a non key city value. Now we have this, we can create a set from this field

Other Cities Set

Ensure all values are selected – don’t worry that you can see cities that aren’t relevant at this stage

Add Other Cities Set to the Filter shelf and also add to the Rows shelf next to the Key Cities field. From the context menu of the Other Cities Set on the Filter shelf, select Show Set. The list of non key cities should be displayed. If there’s more than you expect, ensure the control is set to All Values in Context.

If you uncheck Bowling Green from the list, all the key cities and Bowling Green will disappear, but we don’t want this. We only want the row where City=Bowling Green to disappear. For this we need

Records to Keep

[Key Cities] OR [Other Cities Set]

Add this to the Filter shelf and set to True. Remove the Other Cities Set from the Filter shelf (the list should remain). Now if you remove Bowling Green, only that row should disappear, and if you uncheck all, so no city is selected, the key cities should remain

Adjust the display so the rows are sorted by Sales descending (either use the Sort button in the toolbar, or set the sort on the City field).

Then create a field

Sort Order

CASE [pSort]
WHEN ‘Key Cities’ THEN [Key Cities]
ELSE TRUE
END

Add this to the Rows in front of City, and show the pSort parameter (see above for details if you haven’t created this yet). When pSort is set to Key Cities, manually change the order of the values displayed so True is listed before False. The rows are displayed in descending Sales value for each Sort Order Value. When Sales is selected to sort by, the Sort Order is true for all rows.

Now we’ve got all the components needed to build the viz, and you should be able to adapt the steps above to get it to work. The key difference is using the Records To Keep field on the Filter shelf, displaying the members of the Other Cities Set to control the filtering, and managing the sort using the Sort Order field instead.

My workbook showing this solution is published here.

Happy vizzin’!

Donna

Filter Challenge : How well do you know Tableau’s Order of Operations?

It was Erica Hughes’ turn to set the #WOW challenge this week. This ended up being a bit of a journey for me, because of one requirement – to use the max date of the dataset.

I typically use a FIXED LOD to determine the max date, which I did initially in this case, and after building a solution, tripped up when it came to adding some of the filters ‘to context’. The context filter meant my Max Date was changing depending on the filter and subsequently I wasn’t getting the right results for the ‘days since last purchase’.

So I ended up having to put my thinking cap back on, and after a lot of trial and error and reading on the internet (including this article by the Flerlage Twins) , I finally managed to get a solution that involved both LOD calculations (including a rarely used INCLUDE LOD) and Table calculations, and no context filters at all. This was a pretty complex solution. The table of data had to include the Order Date on the Detail shelf, resulting in multiple rows per customer showing, which meant I had to then use an INDEX()=1 filter to only show 1 row for each customer. I then used an additional INDEX() against each customer, so I could filter to show only the customers in position 1-10. My solution to this is published here.

After publishing, I checked Erica’s solution and found how she’d handled the max date requirement. It used a concept I haven’t had to use so far, so I decided to rebuild a less complex solution, which is what I will now blog about.

Capturing the max date of data set which isn’t affected by context filters

The usual way to define the maximum date in the data set is to create a FIXED LOD calculation, and this is still required

Max Date

{FIXED :MAX([Order Date])}

This returns 30 Dec 2021.

The problem is, once a context filter is applied to a sheet, the value of this field can change. For example, if Region is applied as a context filter and set to ‘South’, then what Tableau will do, based on the ‘order of operations’, is first filter all the data to just those records where Region=South. It will then work out the max date of these filtered records, and if there are no orders on 30 Dec 2021 for the South Region, then the value of the Max Date field will differ. This is because context filters get applied before FIXED LOD calculations. We need a way to ensure we can retain the 30 Dec 2021 without hardcoding it.

The solution is to use a parameter.

pMaxDate

A date parameter which is set to use the value of the Max Date field when the workbook is opened.

This is quite a sneaky but clever way to retain this, which is why I’m reworking my solution to use it, so I have something for future reference myself. When the workbook opens, the pMaxDate parameter will get set to 30 Dec 2021 and won’t ever change, whereas the Max Date field will change if context filters are used.

Building the Table

It may seem a bit odd, but I’m going to start with the table of data that’s displayed, as this requires the most calculations, and the most validation.

On a new sheet, add Customer Name, Customer ID to Rows and Sales onto Text. Order by Sales desc. Format Sales to $ with 0dp.

We need to determine the latest order date for each customer in order to work out other information.

Latest Order Date

{FIXED [Customer ID] : MAX([Order Date])}

This finds the maximum Order Date for each Customer.

And with this, we can now work out

Days Since Last Purchase

DATEDIFF(‘day’, [Latest Order Date], [pMaxDate]

Note this is comparing the Latest Order Date to the pMaxDate parameter instead of Max Date.

Format this to custom number, with 0 dp and a suffix of ‘ days’.

Add Latest Order Date to Rows (exact date, discrete) and Days Since Last Purchase into the table.

Now we need to work out

Latest Order Amount

{FIXED [Customer ID]: SUM(IF [Order Date]=[Latest Order Date] THEN [Sales] END)}

For each customer, if the Order Date is the same as the Latest Order Date, then retrieve the Sales value.

Format this to $ with 0 dp and add to the view.

Now add Customer ID to the Filter shelf and set to filter by the Top 10 based on Sales.

To validate the behaviour of the calculations add Region to the Filter shelf and select ‘South’. You’ll notice only 8 rows are shown, and not 10.

This is because the data has been filtered based on the top 10 customers with the most sales first, and then restricted those top 10, to those with sales in the South. Only 8 of the top 10 customers have sales in the South, hence the 8 rows.

To resolve this, we need to add Region to Context (right click on the filter and Add to Context . This has the effect of filtering all the data by Region = South first, and then displaying the top 10 customers by Sales. We now have 10 rows displayed.

Add State to the Filters shelf, and add that to context too. Test the table of results by selecting different combinations of regions and/or states and comparing to the results on Erica’s solution to verify all the calculations are behaving as expected.

Now we’re happy the table is displaying the data as expected, we can format it and make it ready for the dashboard :

  • Remove Latest Order Date & Customer ID
  • Set the Row Banding
  • Set the Row Dividers to Level 0, so only row lines appear at top and bottom
  • Remove Column Dividers
  • Format all text (row/column headings & text data) to be 8pt.
  • Alias Sales to be Total Sales (right click on the Sales title in the columns and Edit Alias)
  • Remove Region & State from the Filter shelf. These will get re-added later.

Building the Map

On a new sheet, double click State to load a map (you may need to set your location to United States : Map menu -> Edit Locations).

Change mark type to a Filled Map, add Region to Colour and adjust colours.

Remove all map layers (Map menu -> Map Layers and uncheck all options listed on left hand side). Change border on Colour shelf to white.

Remove row & column dividers, and remove all map options (Map menu -> Map Options and uncheck all options).

Drag a new instance of State onto the canvas and Add a Marks Layer. This will create a 2nd marks card on the left. Change the colour of the circles to black. Add Sales to the Size shelf and adjust. Adjust the tooltip of both marks card (you’ll need to add Sales to the Tooltip on the map marks card).

Building the Legend

On a new sheet add Region to Columns and type in MIN(1) into the Columns shelf too. Add Region to the Label shelf, and the Colour shelf. Adjust the height of the rows, so you can see the text.

Edit the axis so it is fixed from 0 to 1. Then format the Label so the font is larger and centred.

Hide the axis and the Region (uncheck show header). Remove row & column dividers and any gridlines. Adjust the border on the Colour shelf to be white. Set the tooltip not to show.

Building the Bar Chart

On a new sheet, add Sub-Category to Rows and Sales to Columns. Order by Sales desc. Add Sub-Category to the Filter shelf and set to show Top 10 by Sales. Reduce the Size of the bars, and align the row labels to be left aligned, and the font to be 8.

Format the axis, so the values are displayed in $K.

Hide the row label, and adjust Tooltip. You may need to create an additional calculated field based on Sales to add to the Tooltip which you can then format to $ with 0dp.

Adding the interactivity & context filters

Add the sheets onto a dashboard. You’ll need to use a mixture of vertical & horizontal layout containers, inner and outer padding and background colours to get the required layout.

Add a dashboard filter action which runs on Select when the Legend sheet is selected, which affects all other sheets and shows all values when unselected.

Add another filter dashboard action, which this time runs on Select when the Map sheet is selected, which affects all sheets except the Legend sheet, and also shows all values when unselected.

Now click on one of the regions in the legend, then click on a state in the map. This has the effect of adding filters to the shelves on the other sheets. Navigate to the Table sheet, and add the 2 ‘Action’ filters to context

Do the same for the Bar char sheet.

And you should now have a completed viz. My published version based on this solution is here.

Happy vizzin’!

Donna

Can you build a “must include” filter?

Ann Jackson set this week’s challenge inspired by a business requirement she’d encountered, which was to be able to filter the data based on a user selection, and then additionally apply another filter to narrow down the required data.

The task ‘splash’ page had already indicated the challenge would involve sets, and the requirements additionally stated you’d need version 2020.2 or higher, which added an additional hint that set controls would be involved. Examining Ann’s solution, I could also see that the tell-tale set icon displayed when hovering near the input control, which confirmed the ‘filters’ were indeed using the set control functionality.

  • Building the bar chart
  • Viz in Tooltip
  • BANs

Building the bar chart

Let’s start by focusing on the bar chart. The first thing to do is to rename several fields. Ann likes capital letters, so the following fields just need to be renamed so they’re all in uppercase: Sales, Quantity, Product, Order ID and Customer (Name). Sales can also be formatted to $ with 0dp.

We create the first set we need by simply right-clicking on the PRODUCT field -> Create -> Set. I named this 1st Products and set to the Use All condition.

Lets build out a basic table and then we can play with how we need to use this set. Put

  • ORDER ID on Rows
  • CUSTOMER on Rows
  • Add Sales to Text
  • Drag Quantity over the Sales column, so Measure Names gets added to Columns and Measure Values is on Text
  • Sort by Sales descending

If we now add the 1st Products set to the Filter shelf and choose the Show Set option, the list of products in the set will be displayed for selection.

Choose the 1st item in the list, and the data will be filtered to just those customers who have ordered that product

But, while this list matches the names if you do the same on the solution, the Sales and Quantity values differ. This is because, we have actually filtered the data just to the lines containing the selected product. If you bring PRODUCT onto Rows, you’ll see you have 1 line per customer.

Now, while you can use LOD calculations to compute the total sales/quantity at an order id level, to resolve this, it won’t solve the next step of the puzzle, to filter the data further by other products on the same orders, as we’ve already filtered out all the other data. So we need to do something else.

To demonstrate, we just want to keep a handle on these specific ORDER IDs so ctrl-click to select them all, and then Include to add them to the Filter shelf. Now remove the 1st Products set from the Filter shelf, then re-add back to the Rows.

You’ll see we now have all the product lines on each order, with an In or Out displayed against each row. The rows which match the PRODUCT selected in the set, is marked as In. This is essentially what the filter is doing if 1st Products is on the Filter shelf – it is filtering the rows to those which return as In (the set).

We basically want a way to be able to identify all the rows on an order which have at least 1 In row, so we can filter on that instead. For this we can create a new field,

Order has 1st Products

{FIXED [ORDER ID]: MAX([1st Products])}

What this is doing is saying for each ORDER ID, get the maximum 1st Products value, which is then ‘stored’ against each row for the same ORDER ID. This may look odd, as 1st Products from the display is showing an ‘In’ or an ‘Out’, so how does the MAX work? Well, whilst the display is In or Out, under the bonnet this is actually a boolean field of 1 = True = In or 0 = False = Out, so the MAX is actually returning either a 1 (true) or a 0 (false).

If you add Order has 1st Products to Rows, you can now see every row in this restricted data set is listed as True

Remove the ORDER ID from the Filter shelf, and you should observe all the other orders listed have False listed against every row.

So we can now add Order Has 1st Product = True to the Filter shelf, and we can remove 1st Products from Rows too.

So we’ve mastered the 1st product filter, time for the 2nd. Once again right-click on PRODUCT and create another set with the Use All condition. This time I called the set 2nd Product.

Just as before, we want to identify all orders that contain this 2nd product selected, so we’ll create another calculated field

Order has 2nd Product

{FIXED [ORDER ID]: MAX([2nd Product])}

Add this field to the Filter shelf and select True. Now click on the 2nd Product set in the Dimesions pane, and selected Show Set, to display the list of products

You’ll notice though that all products are listed, and not just the ones that are associated to the set of orders already filtered. To fix this, we need to add the Order Has 1st Products field to context (click on the Order Has 1st Products pill on the Filter shelf and Add to Context). This will change the pill to a grey colour, and you can now restrict the values in the 2nd Products set to only show All Values in Context.

The add to context function allows us to dictate the order in which the filtering is applied, so the data is primarily filtered based on our 1st Products set and then filtered based on the 2nd Product.

You should now be able to play around with the filtering and see how the rows for complete orders are retained.

Removing PRODUCT from the Rows, and we get back to the total order value / quantity values we’re expecting.

From this, you should now be able to build out the viz. Firstly, duplicate the sheet so we retain the original table, then move SALES & QUANTITY to the Columns, add Measure Names to Colour, add Labels to match mark colour, and format accordingly.

Viz in Tooltip

As an ‘added extra’ Ann added the ability to hover on a bar and see the details of the order in a simple table. We can use the original table we built above to demonstrate the functionality. Add PRODUCT to Row, and replace the QUANTITY field, with a new field you need to create called QTY, which is just based on QUANTITY ie

QTY

[QUANTITY]

Then hide the ORDER ID & CUSTOMER fields (uncheck Show Header) on the pill. You could remove completely, but I like to retain just in case we need to debug if things don’t work.

We will need to show some totals, but this isn’t the Grand Total. Grand Totals will work, but the background of the row will always be a fixed colour. Either white, by default, or set to grey if you choose. However I noticed that depending on the order id I hovered on, the Grand Total row may display grey or white depending on the existing banding. For this we need to use subtotals instead (Analysis menu -> Totals -> Add All Subtotals).

Because we have multiple (hidden) dimensions on the rows, multiple Total rows will display. We can remove by unchecking the Subtotals option against the ORDER ID pill.

And finally, we need to relabel the row. Right-click on the Total row and select Format. Change the label of the Totals section from ‘Total’ to ‘Grand Total’.

With additional formatting to change the font size etc, this sheet can now be added as a ‘Viz in Tooltip’ to the bar chart. On the Tooltip shelf associated to the bar chart, you can Insert -> Sheets -> <Select Sheet>

Hovering over a bar should now automatically filter the tabular display to the appropriate CUSTOMER & ORDER ID.

BANs

For the BANs, we need several additional calculated fields

# ORDERS

COUNTD([ORDER ID])

simply counts the number of distinct Order IDs in the filtered view.

Total Orders

{FIXED:COUNTD([ORDER ID])}

an LOD calculation that counts the overall number of distinct Order IDs, regardless of any filters applied.

% OF TOTAL ORDERS

[# ORDERS]/SUM([Total Orders])

formatted as a % to 1 dp.

AVG ORDER AMOUNT

SUM([SALES]) / [# ORDERS]

formatted to $ 0 dp.

AVG ORDER QUANTITY

SUM([QUANTITY])/[# ORDERS]

formatted to a number with 0 dp.

Add Measure Names to the Filter shelf, and filter to the relevant 4 measures. Add Measure Values and Measure Names to the Text shelf, and Measure Names on Columns. Add the Order Has 1st Products = true and Order has 2nd Product = true to the Filter shelf, but this time don’t add anything to context. If you do, it will affect the Total Orders measure, and the % of orders calc will be wrong. Hide the Measure Names on the columns (uncheck show header), and format the text appropriately.

To get the thick lines, format and set the Row Divider on the sheet to be a thick coloured line.

And you should now have all the core building blocks needed to add onto a dashboard.

My published viz is here.

Happy vizzin’! Stay safe!

Donna

Can you show the top 10 products for each state?

For this week’s #WOW2020 challenge, Sean Miller stripped things right back and went ‘back to basics’.

This blog should be brief as I’m only going to touch on the bits that I think some people might find a little tricky.

The Map Colours

Use the Red-Black Diverging colour palette, centred at 0 to ensure the colours match exactly (this is most noticeable on the Viz in Tooltip table if it’s not centred at 0).

Map Background

On the Map -> May Layers menu, ensure all the items under the Map Layers section are unchecked

Seaboard States

I used the MIN(1) on the Columns shelf and fixed the axis from 0-1 to fill it up.

Top 10 Products

Orders Count

I dragged Order ID into the ‘measures’ section (below the line on the left hand pane if you’re using later versions of Tableau), and chose the COUNTD aggregation. When I added this to the table, I then changed the alias of the field and called it ‘Orders’

Top 10

Add Product Name to the Filter shelf and select the Top tab.

Colouring the columns

This uses the Legend Per Measure functionality. Add Measure Values to the Colour shelf and select the Use Separate Legends option

This will add 3 colour legends onto the canvas. Set the colours of the Profit measure to the Red – Black diverging as with the map.

For the other 2 legends select any diverging colour palette, then click on the coloured square at each end, and select white from the palette displayed. Change the stepped colour to 2, and you’ll find that the measures now don’t look like they actually have a background colour.

Viz in Tooltip

When adding the sheet as a tooltip, I adjusted the size to 500×350

<Sheet name=”Top 10 Products” maxwidth=”500″ maxheight=”350″ filter=”<All Fields>”>

The size of the Top 10 Products sheet should be set to Entire View to ensure you don’t get a ‘View is too large to display’ message on the tooltip

Getting the Top 10 filtered properly

Once the viz has been added as a ‘viz in tooltip’ a State related filter pill will automatically be added to the Filter shelf of the the Top 10 Products sheet. To ensure the top 10 products gets filtered by the state BEFORE the top 10 products by sales are identified, the filter needs to be Added to Context

Arranging on the Dashboard

I managed to tile all the items, except for the ‘Eastern Seaboard States’ title which I floated.

My published viz is here.

Happy vizzin’! Stay Safe!

Donna

Can you show the Year-on-Year Trend?

It’s Community Month over at #WOW HQ this month, which means guest posters, and Kyle Yetter kicked it all off with this challenge. Having completed numerous YoY related workbooks both through work and previous #WOW challenges, this looked like it might be relatively straight forward on the surface. But Kyle threw in some curve balls, which I’ll try to explain within this blog. The points I’ll be focussing on

  • YoY % calculation for colouring the map
  • Displaying the circles on the map
  • Restricting the Date parameter to 1st Jan – 14th July only
  • Showing Daily or Weekly dates on the viz in tooltip
  • Restricting to full weeks only (in weekly view)

YoY % calculation

The data provided includes dates from 1st Jan 2019 to 21st July 2020. We need to be able to show Current Year (CY) values alongside Previous Year (PY) values and the YoY% difference. I built up the following calculations for all this

Today

#2020-07-15#

This is just hardcoded based on the requirement. In a business scenario where the data changes, you may use the TODAY() function to get the current date.

Current Year

YEAR([Today])

simply returns 2020, which I could have hardcoded as well, but I prefer to build solutions as if the data were more dynamic.

CY

IF YEAR([Subscription Date]) = [Current Year] THEN [Subscription] END

stores the value of the Subscription field but only for records associated to 2020

PY

IF YEAR([Subscription Date]) = [Current Year]-1 THEN [Subscription] END

stores the value of the Subscription field but only for records associated to 2019 (ie 2020-1)

YoY%

(SUM([CY])- SUM([PY]))/SUM([PY])

format this to a percentage with 0 decimal places. This ultimately is the measure used to colour the map. CY, PY & YoY% are also referenced on the Tooltip.

Displaying circles on the map

This is achieved using a dual axis map (via a second instance of the Latitude pill on Rows). One ‘axis’ is a map mark type coloured by the YoY% and the other is a circle mark type, sized by CY, explicitly coloured black.

The Tooltip for the circle mark type also shows the % of Total subscriptions for the current year, which is a Percent of Total Quick Table Calculation

Restricting the Date parameter to 1st Jan – 14th July only

As mentioned the Subscription Date contains dates from 01 Jan 2019 to 21 July 2020, but we can’t simply add a filter restricting this date to 01 Jan 20 to 14 Jul 20 as that would remove all the rows associated to the 2019 data which we need available to provide the PY and YoY% values.

So to solve this we need a new date field, and we need to baseline / normalise the dates in the data set to all align to the same year.

Baseline Date

//set all dates to be based on current year
MAKEDATE([Current Year], MONTH([Subscription Date]), DAY([Subscription Date]))

So if the Subscription Date is 01 Jan 2019, the equivalent Baseline Date associated will be 01 Jan 2020. The Subscription Date of 01 Jan 2020 will also have a Baseline Date of 01 Jan 2020.

We also want to ensure we don’t have dates beyond ‘today’

Include Dates < Today

[Baseline Date]< [Today]

Add Include Dates < Today to the Filter shelf, and set to True.

Add Baseline Date to the Filter shelf, choose Range of Dates , and by default the dates 01 Jan 2020 to 14 Jul 2020 should be displayed

Select to Show Filter, and when the filter displays, select the drop down arrow (top right) and change to Only Relevant Values

Whilst you can edit the start and end dates in the filter to be before/after the specific dates, this won’t actually use those dates, and the filter control slider can only be moved between the range we want.

The Baseline Date field should then be custom formatted to mmmm dd to display the dates in the January 01 format.

Showing Daily or Weekly dates on the viz in tooltip

The requirements state that if the date range selected is <=30 days, the trend chart shown on the Viz in Tooltip should display daily data, otherwise it should be weekly figures, where the week ‘starts’ on the minimum date selected in the range.

There’s a lot going on to meet this requirement.

First up we need to be able to identify the min & max dates selected by the user via the Baseline Date filter.

This did cause me some trouble. I knew what I wanted, but struggled. A FIXED LOD always gave me the 1st Jan 2020 for the Min Date, regardless of where I moved the slider, whereas a WINDOW_MIN() table calculation function caused issues as it required the data displayed to be at a level of detail that I didn’t want.

A peak at Kyle’s solution and I found he’d added the date filters to context. This means a FIXED LOD would then return the min & max dates I was after.

Min Date

{MIN([Baseline Date])}

Note this is a shortened notation for {FIXED : MIN([Baseline Date])}

Max Date

{MAX([Baseline Date])}

With these, we can work out

Days between Min & Max

DATEDIFF(‘day’,[Min Date], [Max Date])

which in turn we can categorise

Daily | Weekly

IF [Days between Min & Max]<=30 THEN ‘Daily’ ELSE ‘Weekly’ END

We also need to understand the day the weeks will start on.

Day of Week Min Date

DATEPART(‘weekday’,[Min Date])

This returns a number from 1 (Sunday) to 7 (Saturday) based on the Min Date selected.

Using this we can essentially ‘categorise’ and therefore ‘group’ the Baseline Date into the appropriate week.

Baseline Date Week

CASE [Day of Week Min Date]
WHEN 1 THEN DATETRUNC(‘week’,([Baseline Date]),’Sunday’)
WHEN 2 THEN DATETRUNC(‘week’,([Baseline Date]),’Monday’)
WHEN 3 THEN DATETRUNC(‘week’,([Baseline Date]),’Tuesday’)
WHEN 4 THEN DATETRUNC(‘week’,([Baseline Date]),’Wednesday’)
WHEN 5 THEN DATETRUNC(‘week’,([Baseline Date]),’Thursday’)
WHEN 6 THEN DATETRUNC(‘week’,([Baseline Date]),’Friday’)
WHEN 7 THEN DATETRUNC(‘week’,([Baseline Date]),’Saturday’)
END

Ideally we want to simplify this using something like DATETRUNC(‘week’, [Baseline Date], DATEPART(‘weekday’, [Min Date])), but unfortunately, at this point, Tableau won’t accept a function as the 3rd parameter of the DATETRUNC function.

Let’s just have a look at what we’ve got so far

Rows for California only showing the Subscription Dates from 01 Jan 2019 – 10 Jan 2019 and 01 Jan 2020 to 10 Jan 2020. Min & Max date for all rows are identical and matches the values in the filter. The Baseline Date field for both 01 Jan 2019 and 01 Jan 2020 is January 01. The Baseline Date Week for 01 Jan 2019 – 07 Jan 2019 AND 01 Jan 2020 – 07 Jan 2020 is 01 Jan 2020. The other dates are associated with the week starting 08 Jan 20202.

So now we have all this information, we need yet another date field that will be plotted on the date axis of the Viz in Tooltip.

Date to Plot

IF [Days between Min & Max] <=30 THEN ([Baseline Date]) ELSE [Baseline Date Week] END

If you add this field to the tabular display I built out above, you can see how the value changes as you move the filter dates to be within 30 days of each other and out again.

When added to the actual viz, this field is formatted to dd mmm ie 01 Jan, and then is plotted as a continuous, exact date (green pill) field on the Columns alongside the Daily | Weekly field, with State & Subscription on Rows. The YEAR(Subscription Date) provides the separation of the data into 2 lines.

Restricting to full weeks only (in weekly view)

The requirements state only full weeks (ie 7 days of data) should be included when the data is plotted at a weekly level. For this we need to ascertain the ‘week’ the maximum date falls in

Max Date Week

CASE [Day of Week Min Date]
WHEN 1 THEN DATETRUNC(‘week’,([Max Date]),’Sunday’)
WHEN 2 THEN DATETRUNC(‘week’,([Max Date]),’Monday’)
WHEN 3 THEN DATETRUNC(‘week’,([Max Date]),’Tuesday’)
WHEN 4 THEN DATETRUNC(‘week’,([Max Date]),’Wednesday’)
WHEN 5 THEN DATETRUNC(‘week’,([Max Date]),’Thursday’)
WHEN 6 THEN DATETRUNC(‘week’,([Max Date]),’Friday’)
WHEN 7 THEN DATETRUNC(‘week’,([Max Date]),’Saturday’)
END

so if the maximum date selected is a Thursday (eg Thurs 11th June 2020) but the minimum date happens to be a Tuesday, then the week starts on a Tuesday, and this field will return the previous Tuesday date (eg Tues 9th June 2020).

And then to restrict to complete weeks only…

Full Weeks Only

IF [Daily | Weekly]=’Weekly’ THEN
[Date To Plot]< [Max Date Week]
ELSE TRUE
END

If we’re in the ‘weekly’ mode, the Date To Plot field will be storing dates related to the start of the week, so will return true for all records where the field is less than the week of the max date. Otherwise if we’re in ‘daily’ mode we just want all records.

This field is added to the Filter shelf and set to true.

Hopefully that covers off all the complicated bits you need to know to complete this challenge. My published solution is here.

Happy vizzin’! Stay Safe!

Donna

Can you build a Sales calendar with top 3 highlighting?

An interesting challenge set by Ann this week, which seemed initially to me that it should be quite straightforward, but as usual ended up causing all sorts of frustrations.

The trickiest part was how to show marks for days when there weren’t any sales. From my initial observations of Ann’s viz (hovering over marks etc), I’d figured out that she had made use of the ability to set a sheet’s background as transparent and then float one sheet over the other. This was because when I hovered over the circles with no days displayed, the mark didn’t ‘highlight’ in any way, indicating that it was ‘behind’ something else.

So with this thought in mind, I went about trying to build the basic viz – a calendar view with all days for the background, and a calendar view with just the days with sales to layer over the top.

Ann didn’t state any requirements about how this could be tackled, so I assumed she hadn’t used any sort of date scaffolding (ie using another data set containing all the dates). I therefore tried to do the same, and did end up with something, but it just felt too complex, and wasn’t really ‘future’ proof for a real world scenario, as it relied on each day across a year existing in the dataset being used, regardless of year (ie there was an entry for 1st Jan, 2nd Jan etc all the way through to 31st Dec, but it could be 1st Jan 2016, 2nd Jan 2018 etc). Knowing I had to blog about what I’d done, I decided to take a step back, and approach the challenge based on what I would have done if I was asked to do something similar for work.

I still wanted to incorporate the transparency/floating sheets requirement though, since this was a piece of functionality I believe Ann was trying to demonstrate the use of in this challenge.

Date Scaffold

I first needed to create a data source to use as my date scaffold. This is simply an excel sheet containing 1 column, Date, with 1 row per day ranging from 01 Jan 2017 through to 31 Dec 2019.

I created this, saved the sheet and then connected Tableau Desktop to it. This will provide the data for my background calendar.

Building the Background Calendar

The overall calendar needs to be organised into 3 columns (based on months) and 4 rows (based on quarters). Within each column, there is then a column per day of week and within each row there is a row per week of the year. Essentially we’re building a trellis type chart.

Column Number

When building trellis charts, there’s all sorts of clever techniques to flex the number of rows & columns based on how many ‘entities’ in the data you’re trying to organise. In this instance we’re dealing with months and we know the data is going to be static, so I just created a simple calculated field to determine which column each month should sit in :

CASE MONTH([Date]) WHEN 1 THEN 1
WHEN 2 THEN 2
WHEN 3 THEN 3
WHEN 4 THEN 1
WHEN 5 THEN 2
WHEN 6 THEN 3
WHEN 7 THEN 1
WHEN 8 THEN 2
WHEN 9 THEN 3
WHEN 10 THEN 1
WHEN 11 THEN 2
WHEN 12 THEN 3
END

This field was then added to the columns shelf, and next to it I added WEEKDAY([Date]) .

Top Tip – by right clicking on a Date field in your dimensions pane, and dragging onto the columns/rows shelf, you get a date selection dialog displayed when you release the mouse, so you can quickly choose the type of date you want to display

By default, as I’m based in the UK, my weeks are set to start on Mondays, but the display starts on a Sunday. To fix this, right click on the datasource and select Date Properties

Onto the rows, I added QUARTER([Date]) using same technique as above.

Now I need to get the weeks to display, but if I just add WEEK([Date]) to rows, I get too many rows for each quarter

What I want is to be able to show weeks 6-9 and 10-14 on the same rows as weeks 1-5. To achieve this I created

Week Index

DATEPART(‘week’, [Date]) – {FIXED DATEPART(‘month’,[Date]): MIN(DATEPART(‘week’, [Date]))}

The FIXED part of the calculation is finding the minimum week number for each month. So for January, the minimum week number is 1, for February it’s 5, for March it’s 9. That minimum number is then being subtracted from each week number, so for

  • week 1 (in Jan), I have 1-1 = 0
  • week 2 (in Jan), I have 2-1 = 1 etc
  • week 5 (in Feb) I have 5-5 = 0
  • week b (in Feb) I have 6-5 = 1 etc

Adding Week Index to Rows rather than WEEK([Date]) gives me

which is the layout I’m after.

Restrict the Year

I created a parameter SELECT YEAR which I listed 2017, 2018, 2019. I then created a new calculated field

FILTER : Year

YEAR([Date]) = [SELECT YEAR]

which I added to the Filter shelf and set to True

I then just had to apply some formatting :

  • Set the mark type to circle and choose a light grey colour, increase the size slightly
  • Set the row banding
  • Lighten the row/column divider lines
  • Set the Q1, Q2 etc label headings to white font (this is the background sheet, so I don’t want them to display at all)
  • Set the Sunday, Monday etc label headings to white font
  • Don’t show the Week Index header
  • Don’t show the Column Number header
  • Hide all other column/row labels
  • Name the sheet Backgound

Building the Foreground Calendar

Using the Superstore dataset, I basically repeated all the steps above, but this time referencing the Order Date field in the data set so

Column Number

CASE MONTH([Order Date]) WHEN 1 THEN 1
WHEN 2 THEN 2
WHEN 3 THEN 3
WHEN 4 THEN 1
WHEN 5 THEN 2
WHEN 6 THEN 3
WHEN 7 THEN 1
WHEN 8 THEN 2
WHEN 9 THEN 3
WHEN 10 THEN 1
WHEN 11 THEN 2
WHEN 12 THEN 3
END

Week Index

DATEPART(‘week’, [Order Date]) – {FIXED DATEPART(‘month’,[Order Date]): MIN(DATEPART(‘week’, [Order Date]))}

FILTER: Year

YEAR([Order Date]) = [SELECT YEAR]

which I again added to the Filter shelf and set to True

When plotted on the sheet in the same way, you can start to see the gaps appearing where there is no sales for that day.

I then applied the following changes

  • Set mark type to circle, colour slightly darker grey than that selected above, added border to circle, and adjusted size slightly to match the other sheet
  • Removed the row banding completely
  • Removed the row/column divider lines
  • Set the Q1, Q2 etc label headings to larger font aligned middle & centre
  • Set the Sunday, Monday etc label headings to darker font, and formatted to just show First Letter
  • Don’t show the Week Index header
  • Don’t show the Column Number header
  • Hide all other column/row labels
  • Labelled the sheet Foreground
  • Added Order Date to the Text shelf, setting it to be Discrete Exact Date, then changed the format to dd/mm. Changed font size to 7 and centre aligned.
  • Added Sales to the tooltip, setting the format to be $ with no decimal places
  • Created a copy of Order Date (right click > duplicate), an added the copy to the tooltip, setting the format to be Wednesday, 14 March 2001
  • Adjusted the tooltip to match
  • Changed the background of the whole sheet from white to ‘None’ – this sets it to be transparent, and is the main trick for this display

Highlight Top 3

To achieve this requirement, I first created a parameter HIGHLIGHT TOP 3 containing the values DAYS, WEEKS, MONTHS

When MONTHS was selected, I needed to find the top 3 months in the year, etc. So I created some calculated fields

Total Monthly Sales

{FIXED YEAR([Order Date]), MONTH([Order Date]): SUM(Sales)}

This stores the total month’s sales against every row

Total Weekly Sales

{FIXED YEAR([Order Date]), WEEK([Order Date]): SUM(Sales)}

This stores the total week’s sales against every row

Value

IF [HIGHLIGHT TOP 3] = ‘MONTHS’ THEN SUM([Total Monthly Sales])
ELSEIF [HIGHLIGHT TOP 3] = ‘WEEKS’ THEN SUM([Total Weekly Sales])
ELSE SUM([Sales])
END

This is basically storing the relevant value I need to consider for the Top 3 based on what was selected in the parameter.

I then also created an additional field

Group By Date

IF [HIGHLIGHT TOP 3] = ‘MONTHS’ THEN DATETRUNC(‘month’,[Order Date])
ELSEIF [HIGHLIGHT TOP 3] = ‘WEEKS’ THEN DATETRUNC(‘week’, [Order Date])
ELSE [Order Date]
END

This captures a date at the relevant level on each row depending on the parameter selection.

In Top 3

From the Group By Date field, I then created a set, which I set to be Top 3 by Value

To see how all these fields interact, build a basic viz with Group By Date on rows (exact date, discrete), and Value on Text. Add In top 3 to rows too. Then add FILTER- Year to the filters shelf, and add to context. This step is crucial to ensure the year filter is applied before the set computes its top 3. Use the parameters to see how the values of Group By Date and Value change

So now you can see how the set is working with the parameter, the set can now be added to the Colour shelf of the Foreground sheet, and the colours adjusted accordingly. The FILTER – Year needs to be added to context on this sheet too.

Building the dashboard

So now the two sheets have been created, the dashboard can be built.

I started by setting the size of the dashboard to 1600 x 1300, adding a text field for the title, and text fields underneath for my standard ‘footer’. I then added the Background sheet into the middle between my title & footer, moving the parameters to form part of the title row. I hid the title of the sheet and set to Fit -> Entire View.

At this point everything on the dashboard is tiled.

I then changed the option to floating, and added my Foreground sheet. As with the background, I hid the title and set to Fit -> Entire View.

I then used the position values of the Background sheet (the x & y position and the height & width), to set the position values of the Foreground sheet to be exactly the same. The intention here was the circles on the Foreground should then be positioned directly over the circles on the Background, and as the Foreground was transparent, the circles that were missing on the Foreground where there were no sales, would show through from the Background sheet, along with the row banding & the row/column lines.

However, this just wouldn’t work as I hoped. I checked the padding options, I shifted things slightly left, right, up & down but when I got some circles lining up, others wouldn’t. It really was quite frustrating and I spent some time trying to fix this, but ended up publishing as it was, which you can see here. In truth I was secretly hoping that by publishing to Tableau Public, it would miraculously work, but it didn’t :-(.

I checked out Ann’s viz and she had managed to get it all to line up beautifully, although the position values on her sheets weren’t exact either, so I’m not sure if this was just trial & error to get right too. I’ll have to watch her solution when it’s published.

So that was attempt 1, but I really wasn’t happy, so came up with an alternative…

Take Two – Join the data at source

For this version, I used Tableau’s ability to join two excel data sources together to create a single data source, with 1 row for every day from 01 Jan 2017 to 31 Dec 2019, supplemented by the relevant superstore sales data against each date if there was a sale on that date.

The data was left outer joined, using Date = Order Date as the joining key

I then created the viz on a single sheet using Dual Axis. To get an axis though, I had to create a Week Index (Date) field and a Week Index (Order Date) field (just as the two Week Index fields described above), but when added to the view, they were set to continuous with the axis reversed to ensure the 0 was at the top rather than the bottom.

All the data required to colour the circles, apply the tooltips etc was added to the 2nd Week Index (Order Date) marks card.

The only difference with this version, is that when you hover on the non-labelled circles, they do ‘highlight’. I can live with this, and felt the solution was much ‘cleaner’ and far less complex 🙂 However it does rely on the fact that the types of data sources I was working with could be joined. In my day job, a lot of the data sources I use are published Tableau Server data sources, and as yet Tableau doesn’t allow these to be joined 😦

This version is published here .

Happy vizzin’

Donna