Luke Stanke provided us with this week’s #WOW2022 challenge, to test our LoD knowledge (amongst other things).
From interacting with Luke’s published solution, I figured I needed to start by working out some core calculated fields, before I even attempted to build the viz.
Defining the calculations
Firstly, we just need to determine how many distinct products (ie Product Names) in total were ordered per Category and Sub-Category. As the viz we’re building is already at the required level of detail, the calculation we need is simple
Count Products
COUNTD([Product Name])
That’s the easy bit :-)…. we then need to determine how many products are profitable (for the relevant Category & Sub-Category) every year, in each of the 4 years. This is a bit more complex, and requires several steps (at least it did for me).
We need to know what the Profit is for each Product Name in each year. We can use an LoD for this.
Profit per Product & Year
{FIXED YEAR([Order Date]),[Product Name]:SUM([Profit])}
Popping this into a table view so we can check what’s going on…

We now need an indicator to know whether each value is profitable (ie +ve) or not. I want to return a 1 if it is and 0/null if not, and then I want to be able to ‘sum up’ all the 1’s, so I can conclude if the total is 4, the product is profitable every year. I need another LoD for this
Is Profitable per Year?
{FIXED YEAR([Order Date]), [Product Name]: SUM(INT([Profit per Product & Year]>0))}
[Profit per Product & Year]>0 returns a true or false, and so when true and wrapped within an INT, will return 1. When this field is added to the above view, it is further aggregated by SUM.
At the Product Name & Year level, it just returns the 1’s, 0’s or <nothing> as expected

but when we remove Year from the table (which is necessary for the viz we’ll be building), this field aggregates….

…and scrolling down we’ll find some rows where the value is 4, which means the Product Name has been profitable for every year.
Using this information, we can then create a Set of these products – Right click Product Name > create > set
Profitable Products
contains the set of Product Names where SUM(Is Profitable per Year?) = 4

Now we can identify the profitable products, we need to count how many there are
Count Successful Products
COUNTD(IF ([Profitable Products]) THEN [Product Name] END)
If the Product Name is in the Profitable Products set, then capture the Product Name, and count the distinct number of them.
And now we can compute the percentage of successful products
Pct. Successful Products
ZN([Count Successful Products]/[Count Products])
ZN means I’ll get a 0 for those cases when there aren’t any successful products. Format this to % with 0 dp.
Let’s see all these values in a different table now to verify we’re getting what we expect :

Great! So this has given us the data we need to build the bar chart part of the viz, but what about the barbell? This is based on profit ratio and all we actually need for this is the standard profit ratio calculation
Profit Ratio
SUM([Profit])/SUM([Sales])
formatted to % with 1 dp.
Building the viz
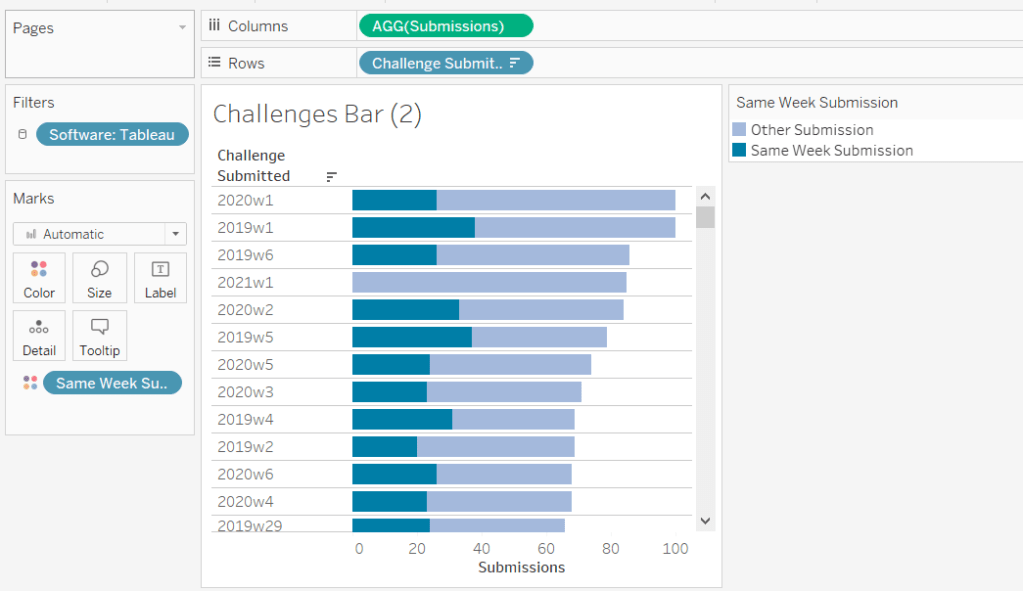
On a new sheet create a basic bar chart with Category and Sub-Category on Rows and Pct. Successful Products on Columns. Sort descending, label the bars and colour accordingly.

Now add Profit Ratio to Columns, and on the Profit Ratio marks card only..
- change mark type to circle
- remove labels
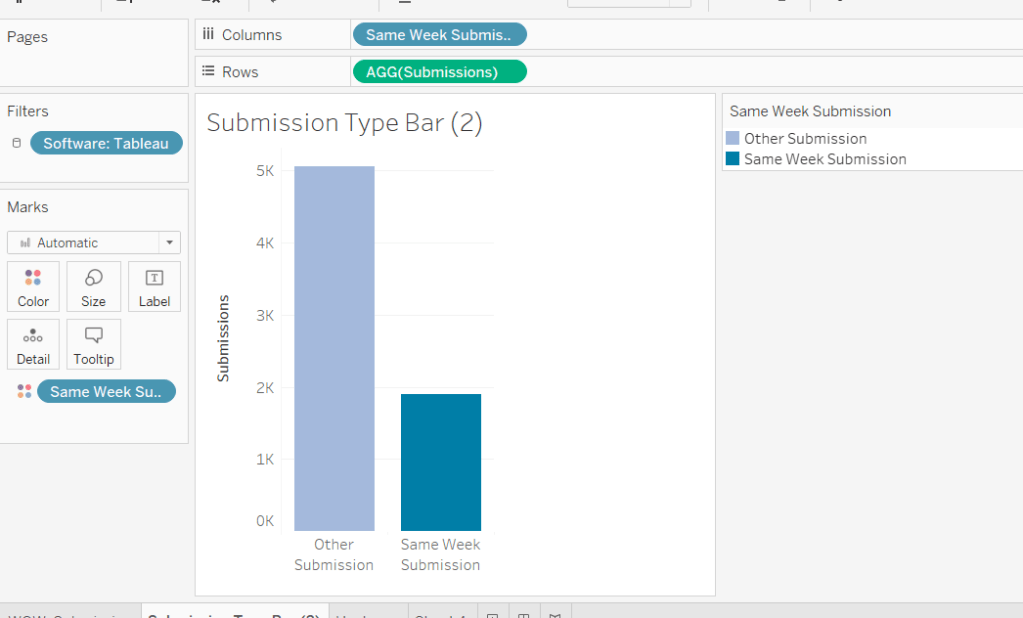
- add Profitable Products set to Colour and adjust
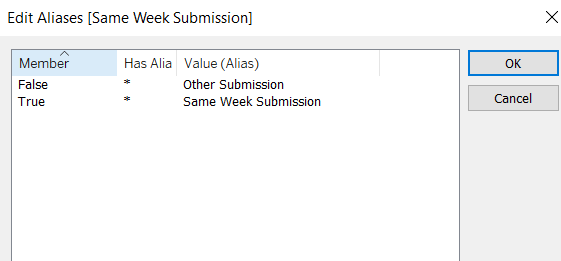
- edit the alias of the values in the colour legend (right click > edit alias)

To create the bar between the circles, add another instance of Profit Ratio to Columns, and on this marks card…
- change mark type to line
- remove labels
- add Profitable Products to Path
- change colour to grey

Now right click on the 2nd instance of the Profit Ratio pill in the Columns shelf and select Dual Axis.
(note – if you lose your bars at this point, change the mark type of the Pct. Successful Products mark cards to bar).
Right click on the Profit Ratio axis at the top and synchronise axis, then right click again and move marks to back, then finally, right click again and uncheck show header.

And that’s the core of the viz really. It needs some final formatting to remove column headers, column gridlines and to add row banding. I also chose to make the tooltips more relevant, so in my solution there are some additional fields on the marks cards to provide the relevant details and commentary.
My published viz is here.
Happy vizzin’! Stay Safe!
Donna