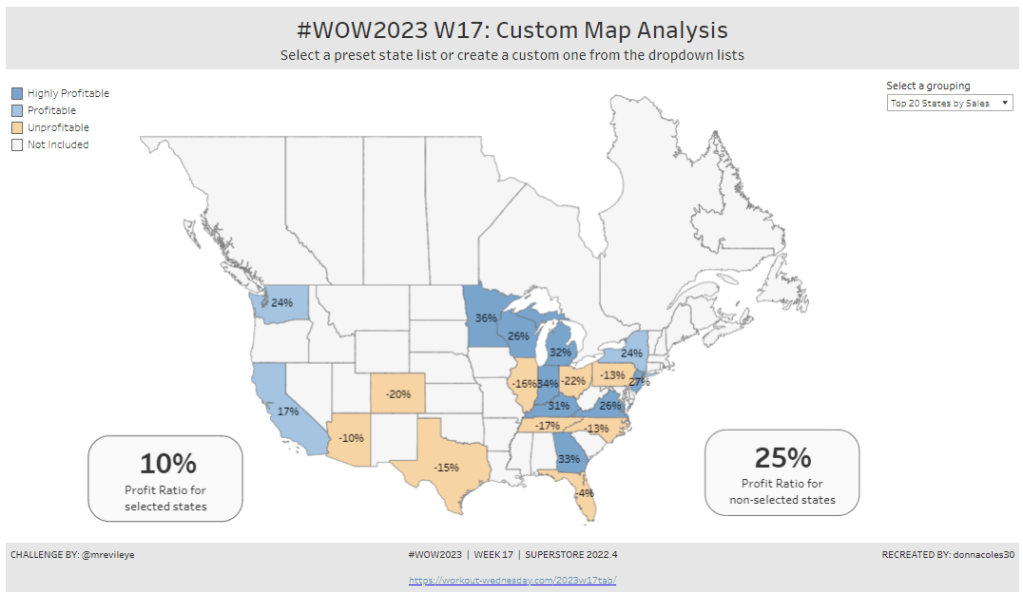
For the final week of Community Month, my colleague, Nik Eveleigh, posed this challenge to apply some tricky filters to a map. Let’s dive straight in!
Identifying the States and Profitability
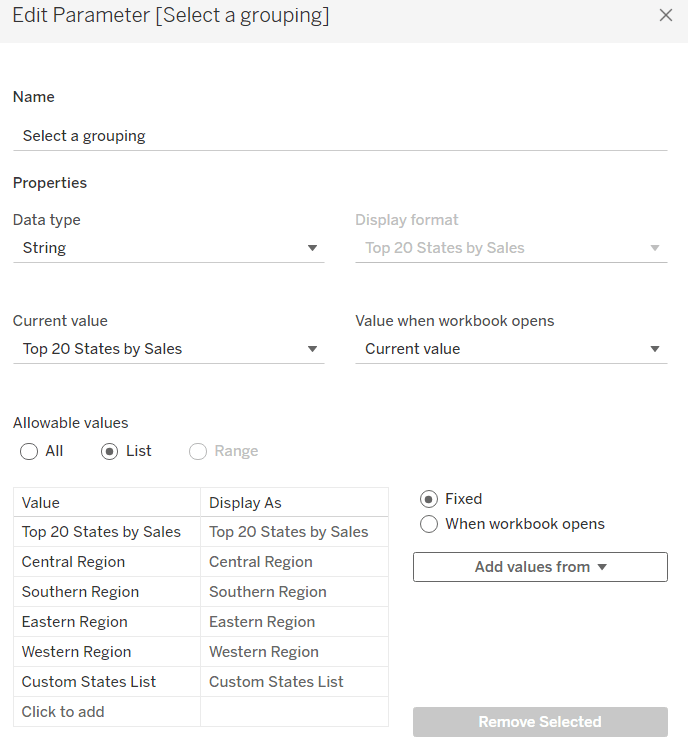
The core functionality of the map display is driven by a parameter allowing the user to select which set of states they want to analyse, so let’s set this up first.
Select a grouping
string parameter containing 6 entries in the list and defaulted to ‘Top 20 States by Sales’
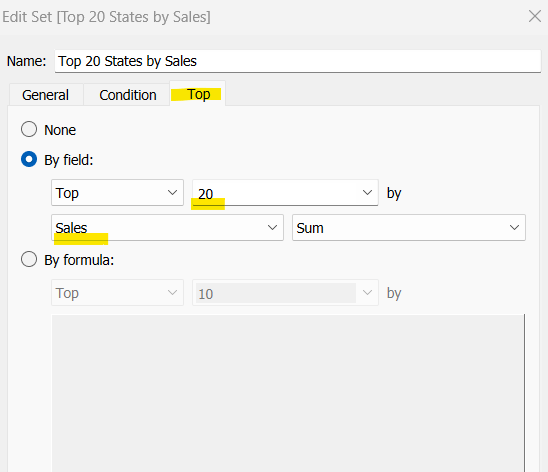
To identify the top 20 States by Sales, we need to create a Set. Right click on State/Province > Create > Set and use the ‘Top’ option to create the set based on top 20 sum of Sales.
Top 20 States by Sales
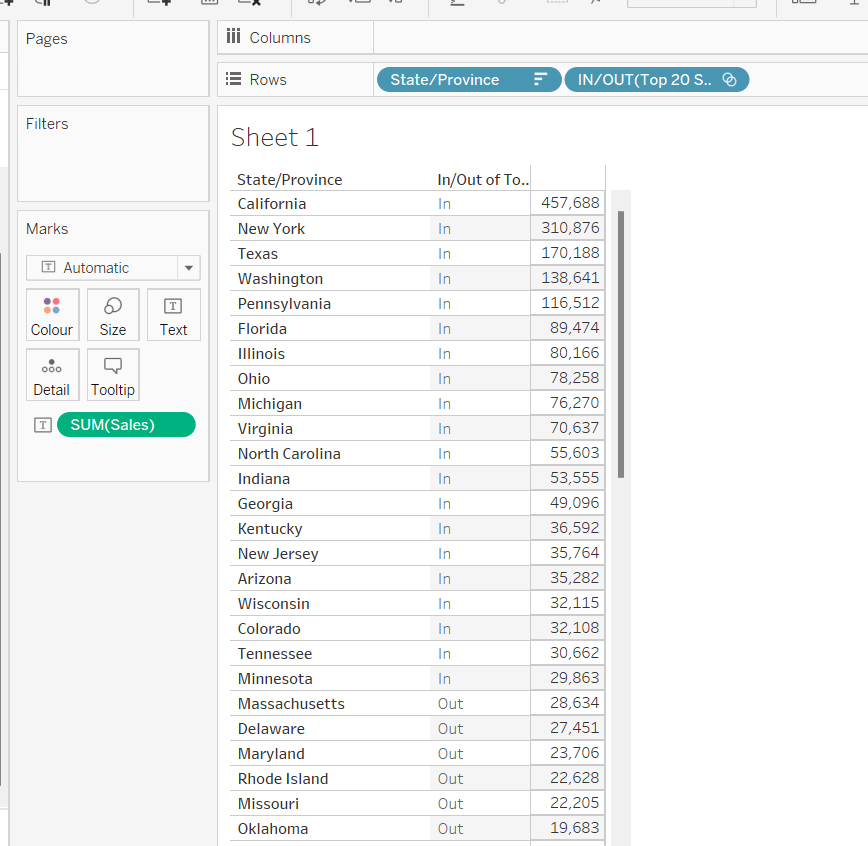
To verify this is working as expected, add State/Province to Rows, Sales to Text and sort descending. The add Top 20 States by Sales to Rows and you should see the first 20 rows with In and the rest listed as Out.
To identify the states selected when the ‘Custom States List’ option is selected, we’ll also need another set to store the selections. Right click on State/Province > Create > Set, leave the list of states all unselected and rename the set
Selected States
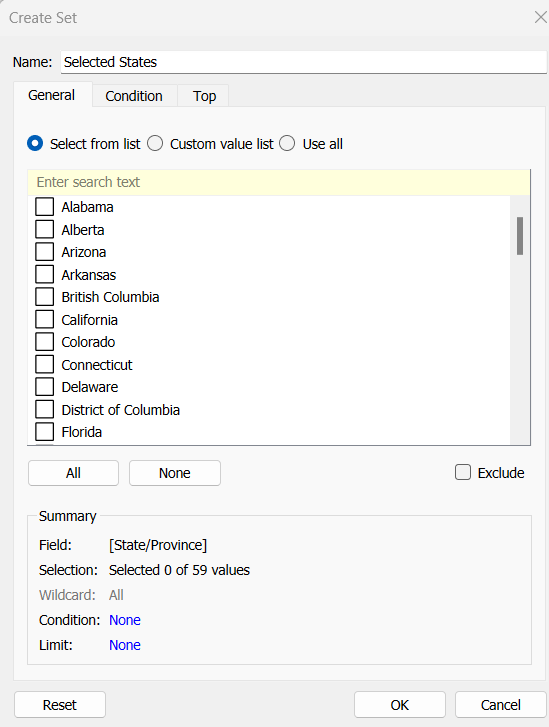
To verify this is working, on a new sheet add State/Province to Rows and Selected States to Rows too. Then on the context menu of the Selected States pill, choose Show Set to get the list of States displayed. Select the first couple in the list and see the value in the table change from Out to In.

It is this set control filter list that will be used to provide the selection when the appropriate value in the Select a grouping parameter is chosen.
While the sets display In or Out when shown in the table, they are actually booleans with the equivalent of a True or False. We now need to build a boolean field which will encapsulate all the relevant states included based on the parameter option selected.
Filter States
CASE [Select a grouping]
WHEN ‘Top 20 States by Sales’ THEN [Top 20 States by Sales]
WHEN ‘Central Region’ THEN IF [Region] = ‘Central’ THEN TRUE ELSE FALSE END
WHEN ‘Southern Region’ THEN IF [Region] = ‘South’ THEN TRUE ELSE FALSE END
WHEN ‘Eastern Region’ THEN IF [Region] = ‘East’ THEN TRUE ELSE FALSE END
WHEN ‘Western Region’ THEN IF [Region] = ‘West’ THEN TRUE ELSE FALSE END
WHEN ‘Custom States List’ THEN [Selected States]
END
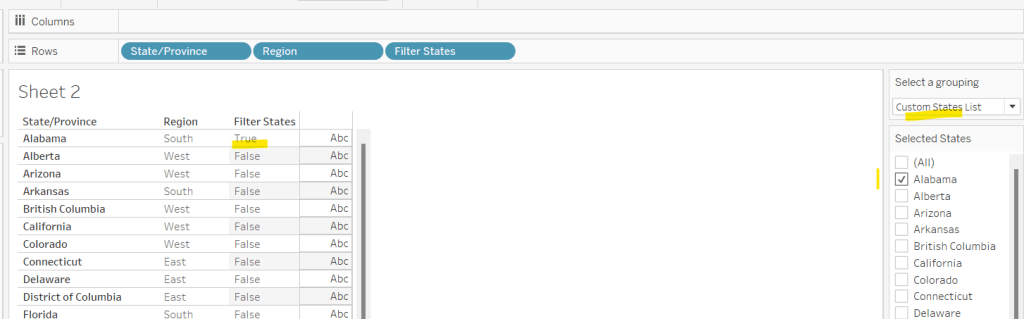
Let’s sense check the workings of this too. On a sheet add State/Province, Region and Filter States to Rows. Show the Select a grouping parameter. Also click on the Selected States field in the left hand data pane and Show Set, so the list of states shows. Ensure all are unchecked. Depending on the option selected in the Select a grouping parameter, then Filter States column should display true or false.
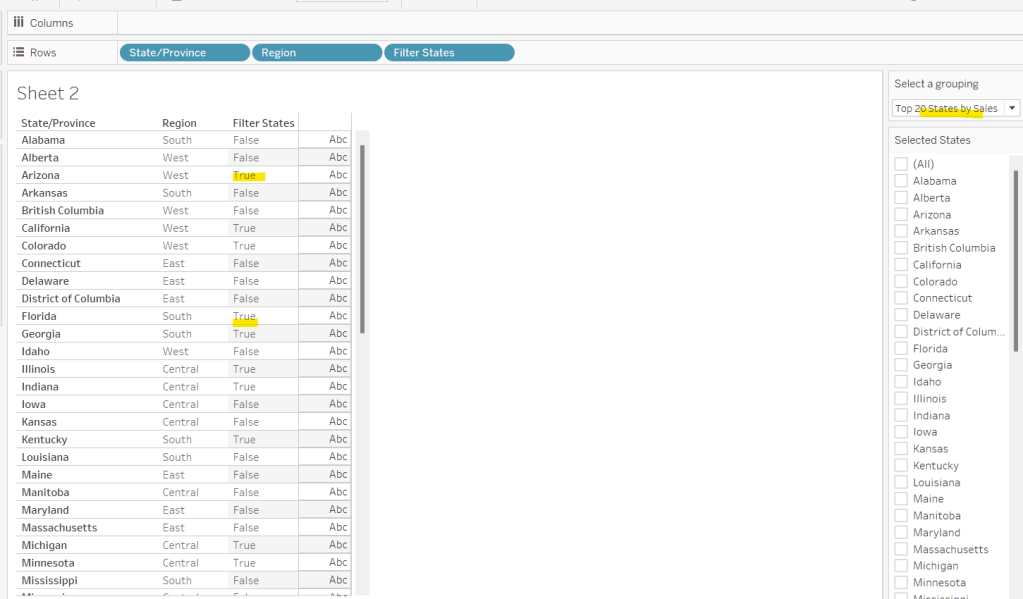
If you select a state from the list, this should only present as True when the Custom States List option is selected
Right, now we know how to identify the states we want, we can start to look at understanding their profitability. Firstly we need to get the profit ration
Profit Ratio
SUM([Profit])/SUM([Sales])
format this to % with 0 dp.
Profitability
IF ATTR([Filter States]) THEN
IF [Profit Ratio] < -0.25 THEN ‘Highly Unprofitable’
ELSEIF [Profit Ratio] >= -0.25 And [Profit Ratio] < 0 THEN ‘Unprofitable’
ELSEIF [Profit Ratio] >=0 AND [Profit Ratio] < 0.25 THEN ‘Profitable’
ELSE ‘Highly Profitable’
END
ELSE ‘Not Included’
END
If the states is one of the filtered ones then work out isn’t profitability ‘bracket’ otherwise report as ‘Not Included’.
Building the Map
On a new sheet double-click on State/Province to automatically generate the map. If the map doesn’t display with US and Canada Edit Locations (via the Map menu) and ensure your settings are as below
Display the Show a grouping parameter and have it set to Top 20 States by Sales. Add Profitability to Colour and adjust colours accordingly.
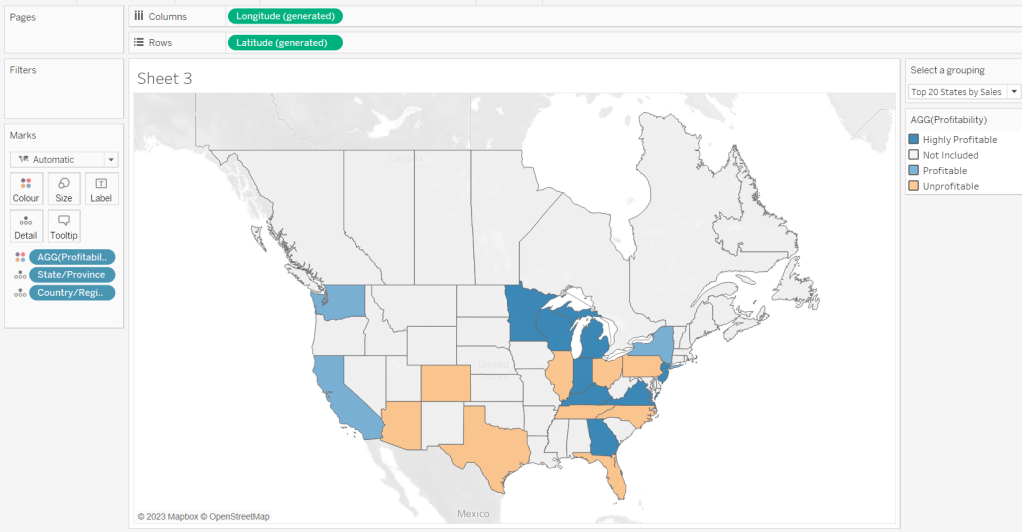
Click on the Selected States field in the left hand data pane and Show Set, so the list of states shows, then test changing the values in the Select a grouping parameter and see the display change.
Clean the map up by clicking Map -> Background Layers, and then unchecking all the options in the Background Map Layers section displayed on the left hand side.
To label the highlighted state we need
Label – PR
IF ATTR([Filter States]) THEN [Profit Ratio] END
format to % with 0 dp and then add to the Label shelf and set the font to bold.
Add Profit Ratio to the Tooltip shelf and adjust the tooltip.
To display the summary Profit Ratio values for all the filtered states vs those not selected, we need
PR by Filter State
{FIXED [Filter States]: [Profit Ratio]}
and then
PR Selected States
ZN({FIXED:AVG(IF [Filter States] THEN [PR by Filter State] END)})
Custom format this with 0%;-0%;–
This formatting with show values with 0dp for positive and negative values and — when no values exists.
Repeat the process to create
PR Non Selected States
ZN({FIXED:AVG(IF NOT([Filter States]) THEN [PR by Filter State] END)})
and apply the same formatting above.
Add both PR Selected States and PR Non Selected States to the Detail shelf and change the aggregation to Average.
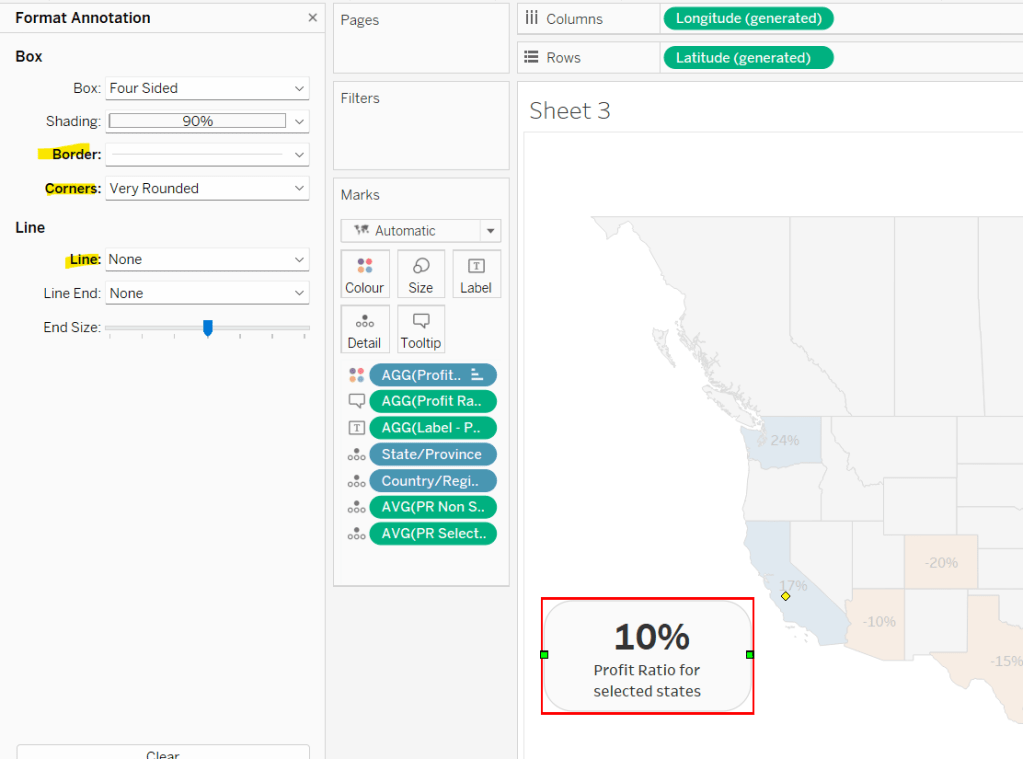
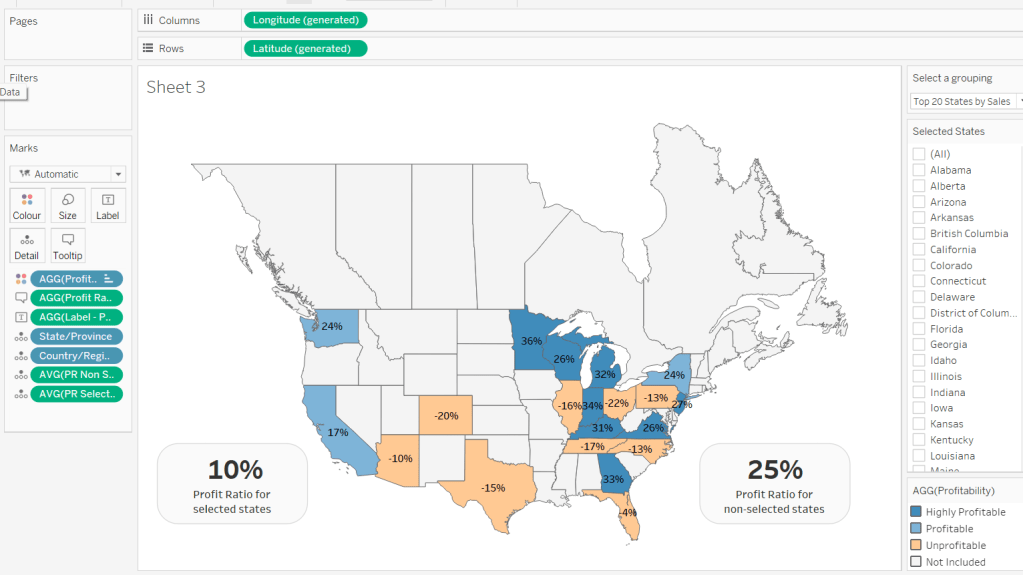
Then click on a state on the bottom left of the map (I chose California) and select Annotate > Mark. Add the reference to the PR Selected States and supporting text into the annotation dialog. The when completed, manually move the annotation to the space to the left of the map. Format the annotation to add a border, round the edges and remove the line. You many need to re-edit the annotation to rec-centre the text.
Repeat a similar process, by annotating a state on the right hand side and referencing the PR Non Selected States field instead.
Finally remove all row & column dividers and hide the map options (Map -> Map Options -> uncheck all selections)
Hiding the Selected States control
In order to control visibility of the Selected States list, we need a boolean field
Custom States Selected
[Select a grouping] = ‘Custom States List’
Once all objects have been added to the dashboard and arranged where you want, click on the Selected States control, so it is selected via a grey border, then on the left hand Layout pane, select the Control visibility using value checkbox and choose the Custom States Selected field
The State list will now only display when the Select a grouping parameter contains the ‘Custom States List’ value.
And that should be it. My published viz is here.
Happy vizzin’!

[…] Read https://donnacoles.home.blog/2023/04/27/custom-map-analysis/ […]
LikeLike