This week’s #WOW challenge is an extension of this challenge which I blogged about here. The premise is to mimic a real world scenario – a dashboard has been built and used, but now, a few months after use, additional functionality is required. I am going to be building on top of the solution I delivered for week 11. If you participated in that week, your solution may not have matched mine, so this guide may not be as coherent.
Identifying the selected states
In part 1, we captured the single state selected within a parameter pSelectedState via a parameter dashboard action. We now need to be able to capture multiple states. We’re still going to use the same parameter and a parameter action, but we need to adapt what will be stored within in it.
Instead of a single state being stored in the parameter, we’re now going use this parameter to build up a delimited list of the states selected. We can then interrogate that string to determine the first and the second state selected, and identify if any additional states have been selected.
When using delimited strings, you need to choose a character to separate the field values that isn’t going to appear within the field value itself; ie choose a character that won’t appear within a State name. In this instance I’m choosing | (pipe), and I’m going to build up the parameter as follows
| Action | pSelectedState |
| No states selected | <empty string> |
| 1 state selected eg Arizona | |Arizona| |
| 2 states selected eg Arizona then Utah | |Arizona||Utah| |
| 3 states selected eg Arizona, then Utah, then Colorado | |Arizona||Utah||Colorado| |
| Existing state is selected again (trigger to reset the view) | <empty string> |
Based on the logic above, we need to modify the existing field
State for Param
IF CONTAINS([pSelectedState], [State]) THEN ” //selected state is already in the parameter, so reset back to ”
ELSE [pSelectedState] + ‘|’ + [State] + ‘|’ //append current state selected to the existing parameter string
END
To see how this is working, go the the dashboard and display the pSelectedState parameter. Click on states and see how the parameter is changing.

As we interact with the hex maps, we can see the list of states building up in the parameter. We’ve obviously lost some of the other functionality now, but that’s ok, we have more things to adapt.
We can now manipulate this string to identify the first two states selected
First Selected State
SPLIT([pSelectedState],’|’,2)
returns the string that comes before the 2nd instance of the ‘|’ (and after the 1st)
Second Selected State
SPLIT([pSelectedStateString],’|’,4)
returns the string that comes before the 4th instance of the ‘|’ (and after the 3rd).
We can then use these fields to set the colour for the map
State Colour
IF [State] = [First Selected State] THEN ‘First’
ELSEIF [State] = [Second Selected State] THEN ‘Second’
ELSE ‘Other’
END
Replace the Is Selected State field that is currently on the Colour shelf and the Shape shelf of the Column (2) marks card, with this new State Colour field. Ensure you have at least 2 states listed in the pSelectedState parameter, so you have options for First, Second, Other all listed in both the colour and shape legends.
Adjust the Shape legend and set the First and Second values to use the same hexagon shape used initially, but set the Other option to use a transparent shape.
Adjust the colours. Increase the opacity on this mark to 100% Set the colours as you wish – I used:
- First – teal : #66b3c2
- Second – light teal : #bce4d8
- Other – pale grey : #d3d3d3
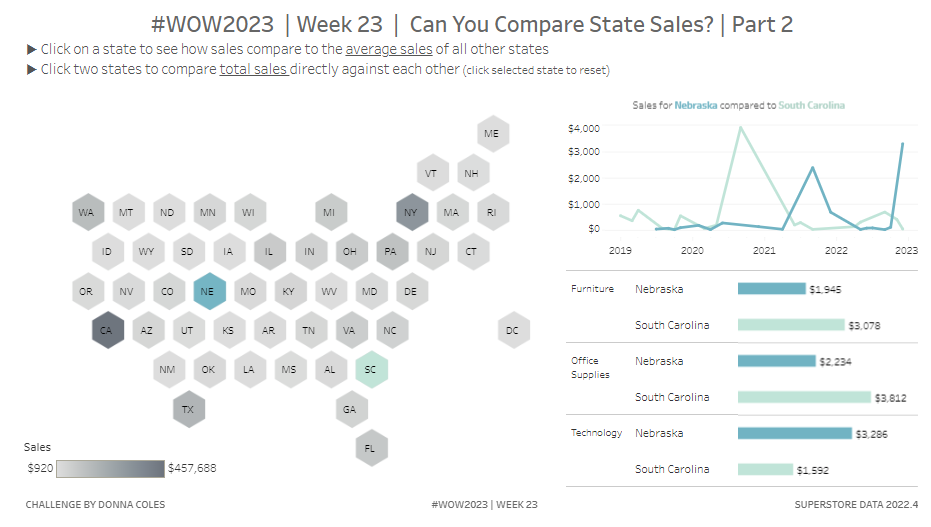
Click around on the dashboard. You should find as you click the first state it is coloured dark teal. Click a second, it is coloured light teal. Click either selected state again, and the map resets. Click more than 2 states, and only the first 2 are coloured, whilst the parameter continues to capture all the states being clicked.

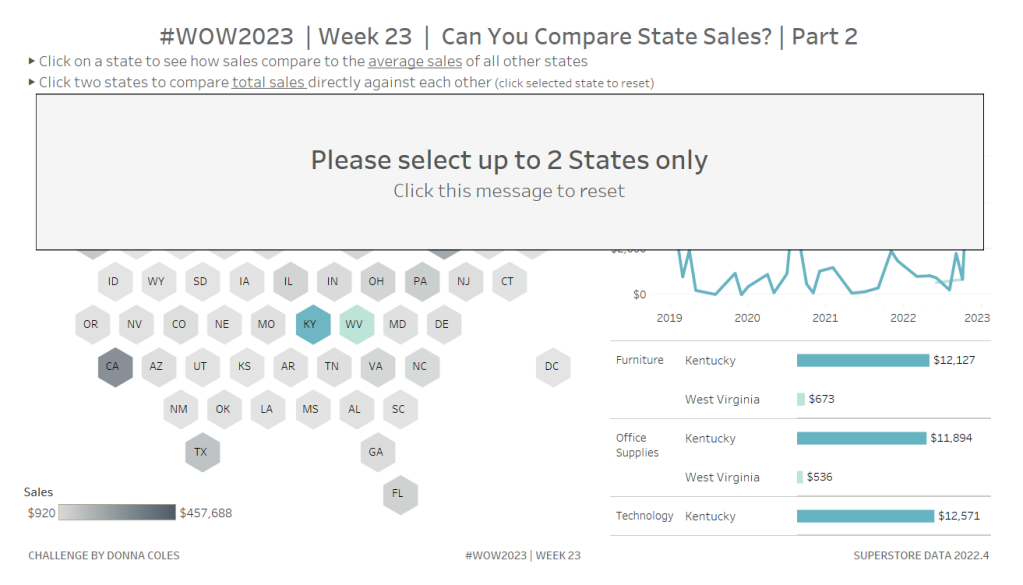
Alerting if more than two states are selected
We will need a field to identify if more than 2 states have been selected.
More than 2 Values Selected?
SPLIT([pSelectedStateString], ‘|’, 6) <> ”
This is looking for a 3rd instance of a value within the delimited string, and returns true if there is one.
As this is a boolean field, we can use it to control the visibility of the message text box we want to display.
We also need to ensure that when the user clicks on the message, it disappears, and the hex map is re-set, ie the pSelectedState parameter gets set back to empty string. Another field will help us with this
State Reset
”
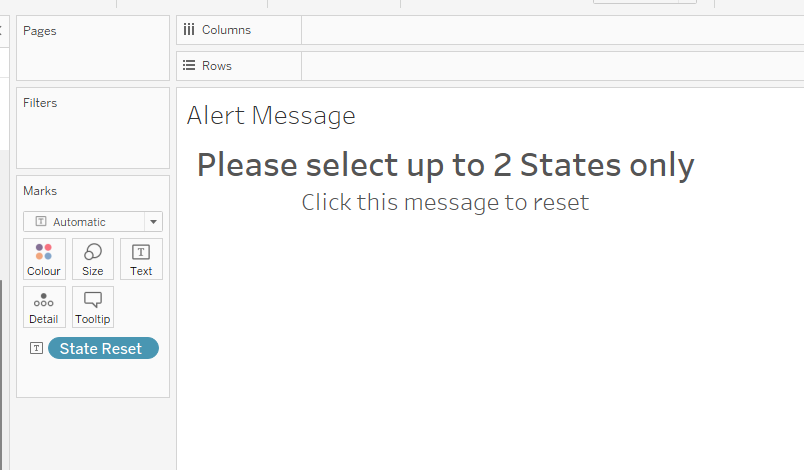
On a new sheet, add State Reset to Text. Then edit the text to the relevant message, and align centrally. Change the tooltip to say ‘click here to reset’. Set the background colour of the sheet to a pale grey. Name the sheet ‘Alert’ or similar.
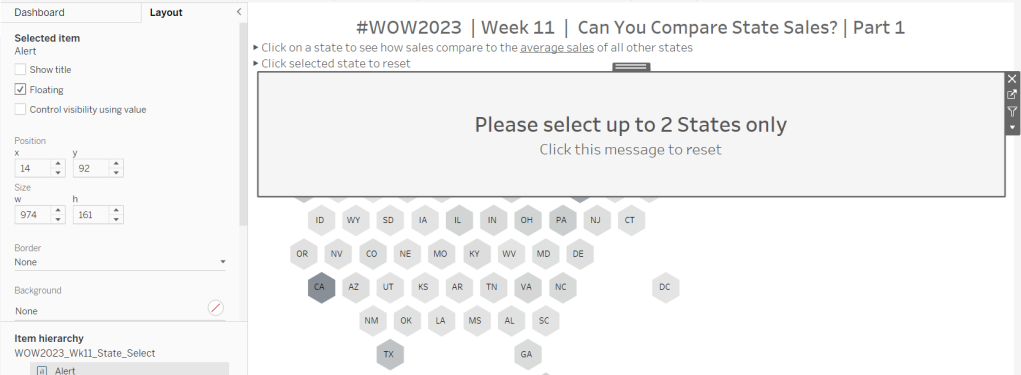
On the dashboard, delete the contents of the pSelectedState parameter and remove it from the dashboard. Add the Alert sheet as a floating object. Set to fit entire view and remove the title. Add a border to the object.
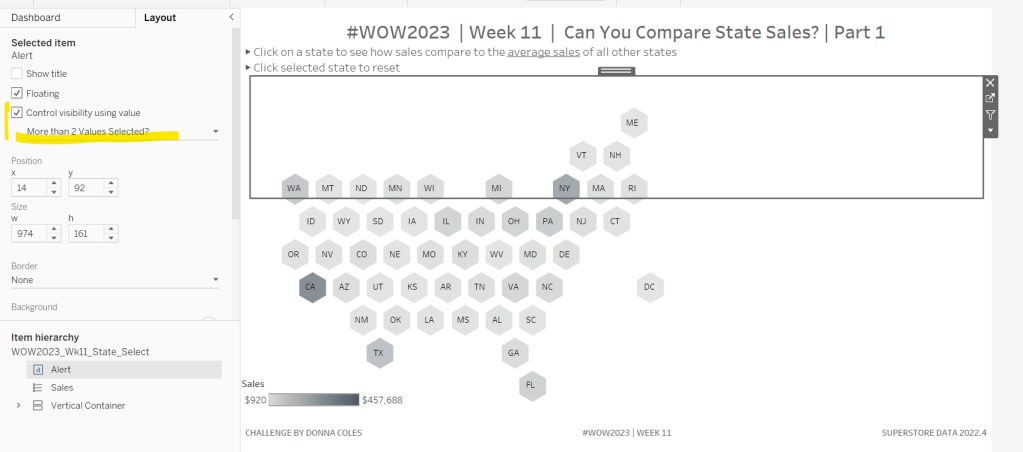
Select the object, then in the Layout pane, set the Control visibility using value option to the More than 2 Values Selected field.
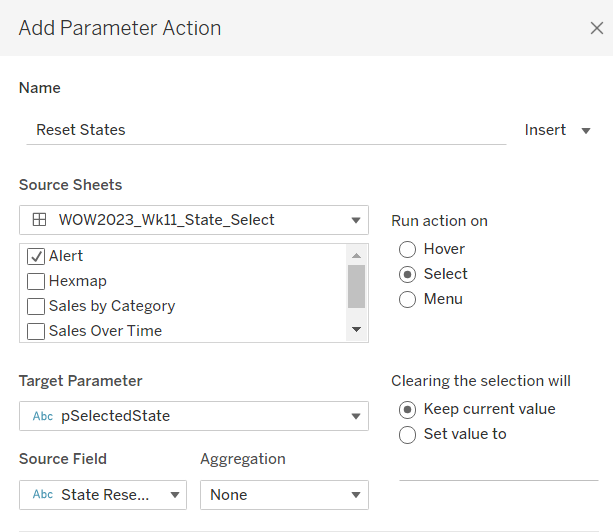
Then add a dashboard parameter action to reset the parameter when the message is clicked
Reset States
On select of the Alert object, set the pSelectedState parameter to the value stored in the State Reset field.
Click around, selecting more that 2 states and test the behaviour. Now we can move on the adapting the other charts.
Adapting the calculations
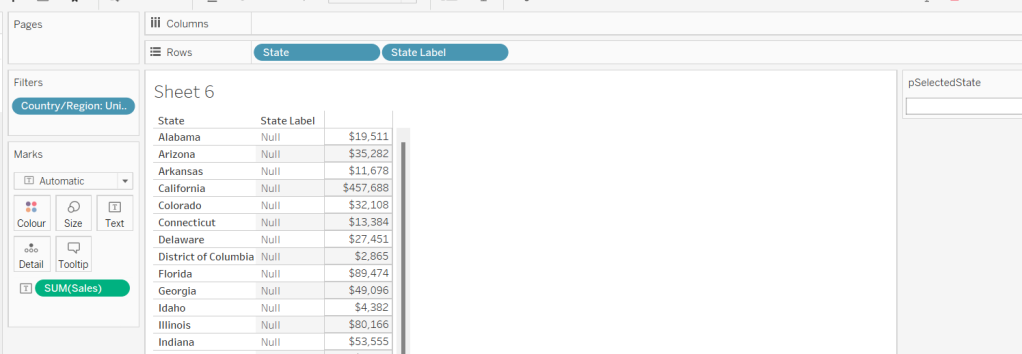
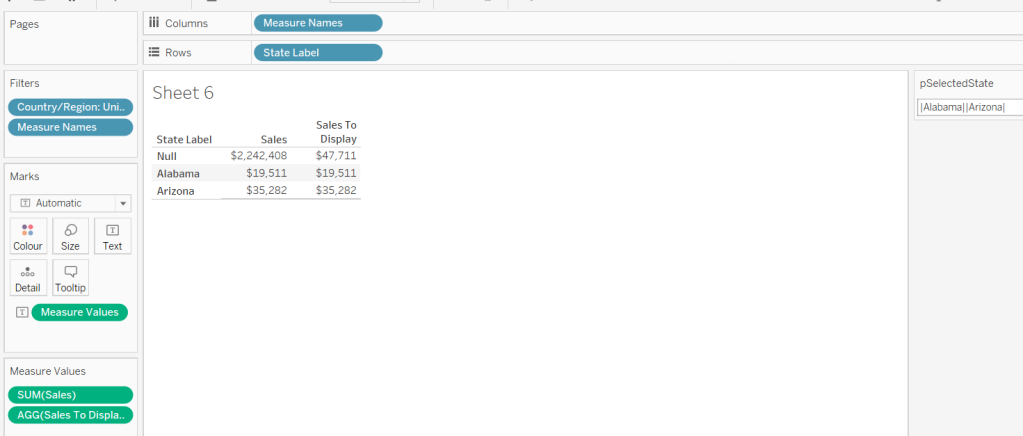
To sense check what is going on, on a new sheet, add State to Rows, Sales to Text and add Country/Region = United States to Filter. Add State Label to Rows, and show the pSelectedState parameter.
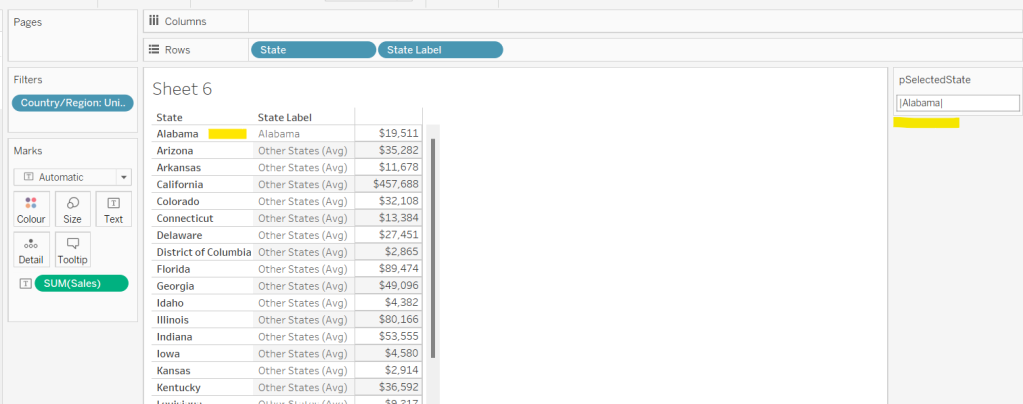
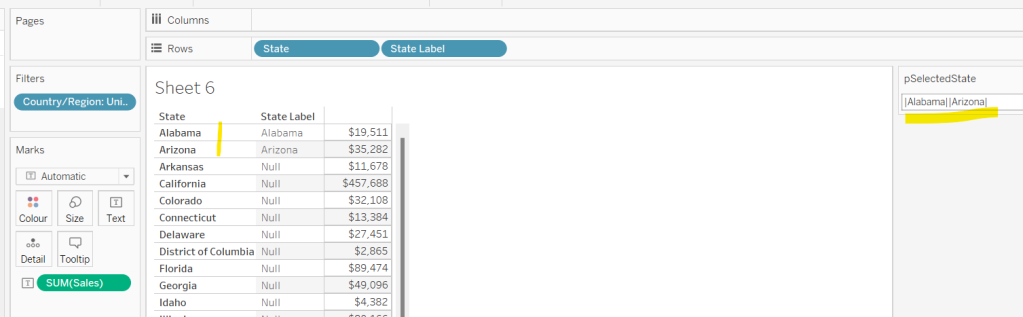
When only 1 state has been selected, we want to display the state against the selected row, otherwise we want to display the text ‘Other States (Avg)’ . When 2 states have been selected we just want the state names against the 2 relevant rows. Otherwise we want NULL to show. We need to adapt the State Label field as follows
State Label
IF [First Selected State] <> ” AND [Second Selected State] = ” THEN
IF [State] = [First Selected State] THEN [State] ELSE ‘Other States (Avg)’ END
ELSEIF [First Selected State] <> ” AND [Second Selected State] <> ” THEN
IF [First Selected State] = [State] OR [Second Selected State] = [State] THEN [State] END
END
Now we need to display a different value for the sales measure depending on whether we have 1 or 2 states selected. So we need to adapt the existing Sales To Display field
Sales To Display
IF CONTAINS([pSelectedState], MIN([State Label])) THEN SUM([Sales])
ELSE SUM([Sales])/COUNTD([State])
END
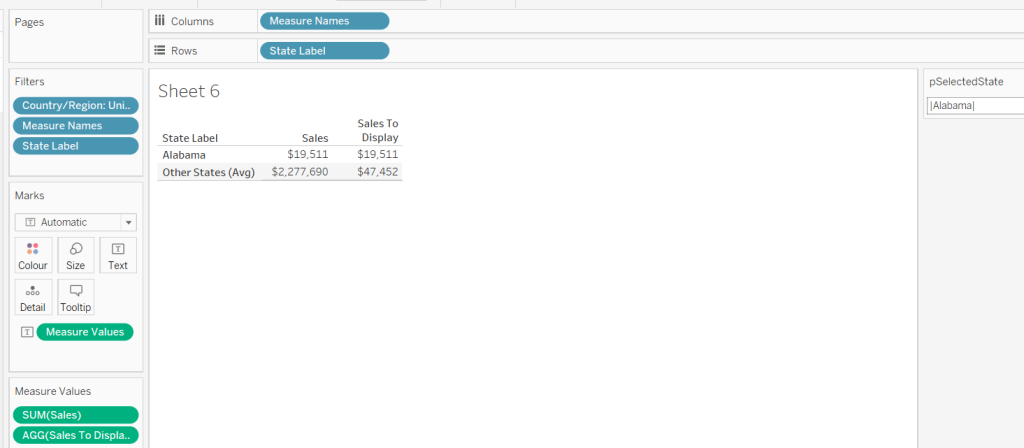
If the parameter string contains the State Label value, then use the sales, otherwise average the sales over the number of states that make up the sales. Format this to $ with 0dp.
Add this to the table, and remove State from the display
Add State Label to the Filter shelf and exclude NULL. Now remove the second state from the parameter and check the result
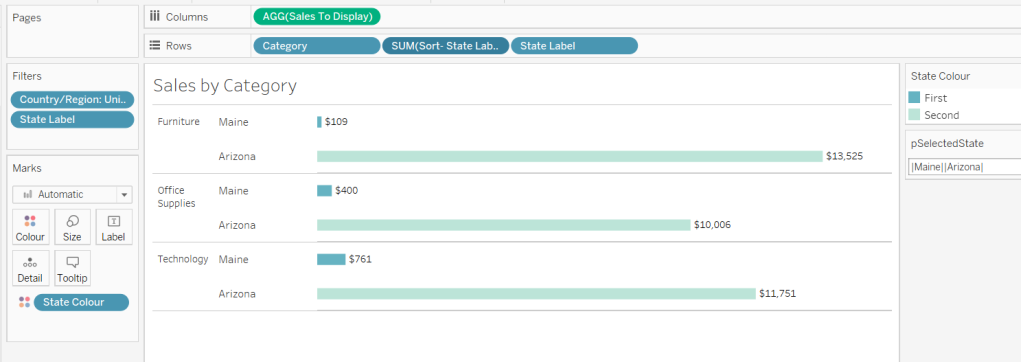
Adapting the bar chart
On the existing bar chart sheet, verify the pSelectedState parameter is displayed. Replace Is Selected State on the Colour shelf with the State Colour field and remove Is Selected State from the Rows shelf.
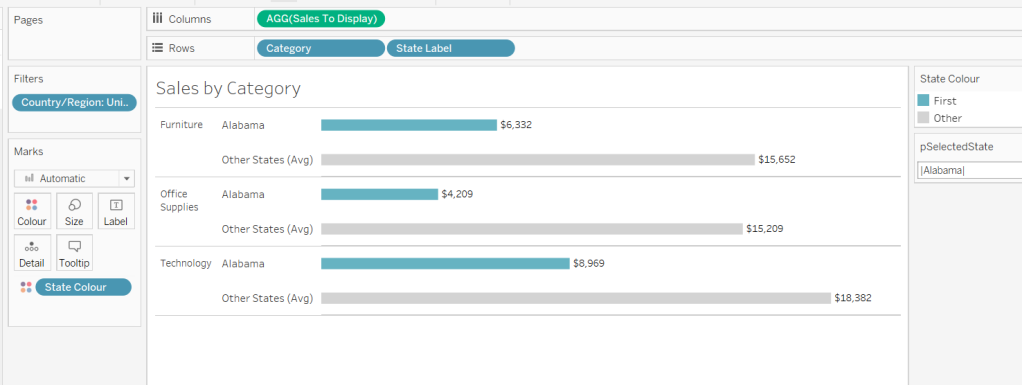
Add another state to compare against. Exclude the NULL values that display (add State Label to Filter and exclude Nulls)
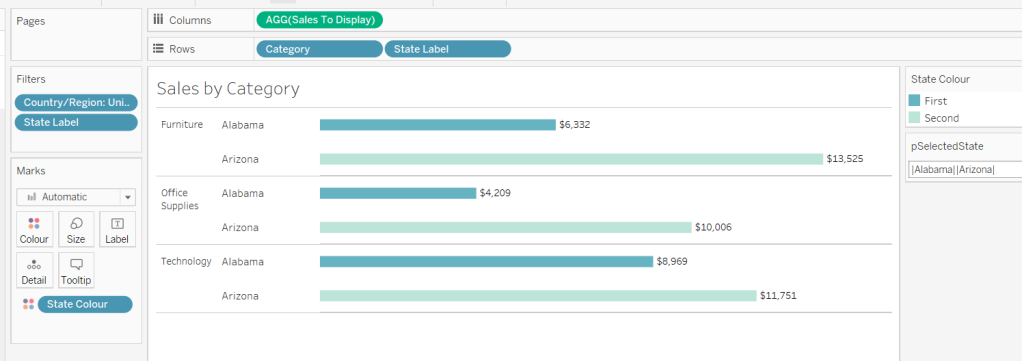
We always want to make sure that the first state selected is listed first.
Sort- State Label
IF [State Label] = [First Selected State] THEN 1
ELSEIF [State Label] = [Second Selected State] THEN 2
ELSE 3
END
Add this field on to Rows as a discrete (blue) pill, between the existing two pills and then hide it.
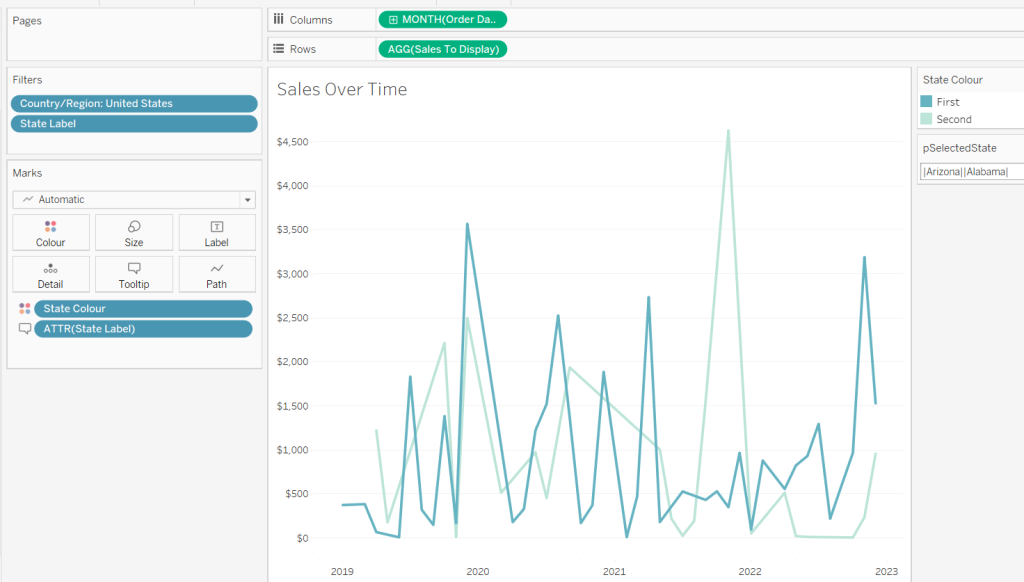
Adapting the line chart
On the existing line chart sheet, verify the pSelectedState parameter is displayed
Add State Label to Filter and exclude null. Replace Is Selected State on the Colour shelf with the State Colour field.
Displaying the additional charts on click.
The display of the bar and line chart are based on the dynamic zone visibility functionality, and the field Show Viz (if you have downloaded my original solution workbook to build onto, you may need to unhide fields in the data pane for this field to be visible).
Amend Show Viz to
[First Selected State] <> ”
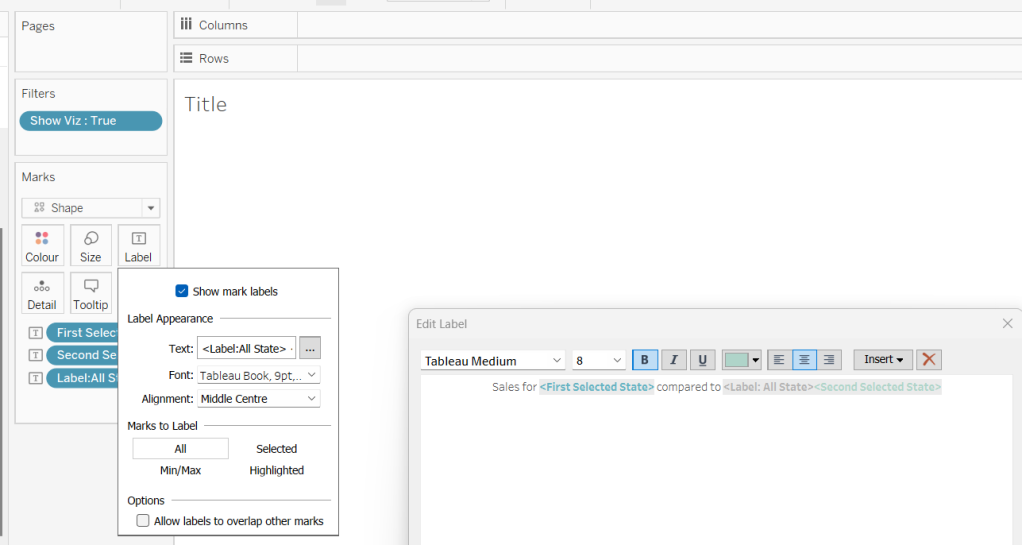
Amending the Chart Title sheet
On the Title sheet, replace the Is Selected State on the Filter shelf with Show Viz = TRUE.
Remove State Label from the Text shelf and add First Selected State and Second Selected State to Text. Additionally create a calculated field
Label:All State
IF [Second Selected State] = ” THEN ‘Other States (Avg)’ ELSE ” END
Add this to Text too.
Adjust the text as below and apply matching colour coding to the fonts. Align the text centrally.
Finally update the title and instructions on the dashboard.
My published viz is here.
Happy vizzin’!
Donna

[…] Read https://donnacoles.home.blog/2023/06/08/can-you-compare-state-sales-part-2/ […]
LikeLike
[…] using 3 sheets and using techniques similar to that described in a previous challenge documented here where I used parameter actions. It’s likely set actions can be used too, although I […]
LikeLike